How to Measure Mobile App ROI for Ecommerce (And Present It to Your Board)

Your app's ROI is measurable across direct revenue metrics (revenue per user, AOV, purchase frequency) and indirect value (retention, push notifications as an owned channel, lifetime value). Here's how to track both, present the numbers to your leadership team, and why the math almost always works in your favor.
Your app's ROI is measurable across direct revenue metrics (revenue per user, AOV, purchase frequency) and indirect value (retention, push notifications as an owned channel, lifetime value). Here's how to track both, present the numbers to your leadership team, and why the math almost always works in your favor.
You know a mobile app should drive revenue for your ecommerce brand. But when your CEO or board asks "what's the actual return on this?", you need more than "apps are good for engagement."
You need a framework that separates direct revenue impact from indirect value, and numbers you can put into a finance deck.
Mobile apps can (and usually do) drive a meaningful lift in revenue for ecommerce businesses. Real revenue - incremental revenue - revenue that would not have existed otherwise.
But you’ve got to have a way to show the ROI; to show the business case for investing in your app. This article breaks down how.
The Direct ROI Metrics That Show Up in Your P&L
These are the numbers that translate directly to revenue and can be tracked in your analytics platform. They're the foundation of any ROI conversation because they're hard to argue with.
Revenue Per User
This is one of the clearest ROI metrics for showing the value of your app.
"Something we’ve noticed is that users who use the app are better customers. Either they spend more or they spend more often."
- Svend Hansen, Bestseller
We consistently find that app users are significantly more valuable (spend more) on a user for user basis.
Here are some examples:
- Country Life Natural Foods: 15x higher revenue per user in the app
- Pharmazone: 15x higher revenue per user
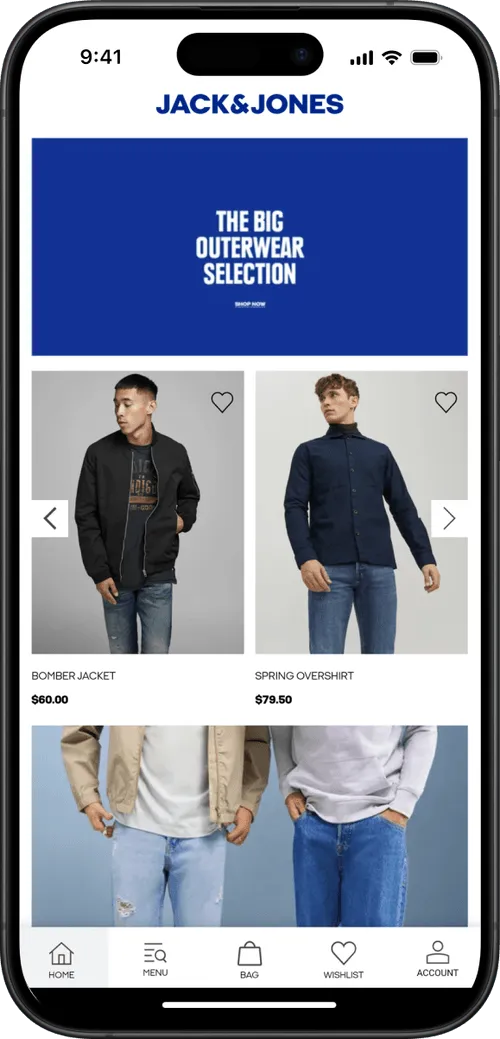
- John Varvatos: 10x higher revenue per user
- Tadashi Shoji: 10x higher revenue per user
- Kiokii: 6.7x higher ARPU vs. mobile web
Some of these customers are just higher-value customers to begin with. It makes sense that these customers congregate in your mobile app. But it’s still valuable to be keeping these buyers closer, in a channel where it’s easier to get in touch, easier for the customer to come back, and naturally higher-retention.
How to measure it: Total app revenue divided by active app users, compared to total mobile web revenue divided by mobile web visitors, over the same period. Use a 90-day or 6-month window to smooth out seasonal spikes.
Average Order Value
App users typically spend 10-50% more per order than mobile web shoppers. A more focused shopping environment, faster navigation, and saved preferences all contribute to these numbers we’ve seen:
- Sleefs: +30% AOV in-app
- XCVI: +30% AOV
- Country Life Natural Foods: +20% AOV
- John Varvatos: +10% AOV
How to measure it: Segment your AOV by channel in your analytics or commerce platform. Compare app transactions against mobile web transactions. If you're using Shopify, you can filter orders by traffic source in your reports.
Purchase Frequency
App users don't just spend more per order; they come back more often. And every additional purchase from an existing customer is pure margin, since you've already paid to acquire them.
- John Varvatos: 12x more sessions per app user vs. mobile web
- Freedom Rave Wear: 5.75x more sessions per user
- Country Life Natural Foods: 5x more sessions per user
- Pharmazone: 5x more frequent sessions
App users purchase roughly 33% more often than non-app users. And 60% of first-time app buyers make at least one more purchase, compared to lower repeat rates on mobile web.
How to measure it: Track orders per customer over a 90-day window, segmented by channel. Compare the repeat purchase rate of app users against your mobile web and desktop cohorts.
Customer Lifetime Value Uplift & Revenue Contribution
App user CLV is typically 2.8-5x higher than web-only shoppers. The compounding effect drives this: more frequent visits lead to more purchases, which increase total spend, which improves your unit economics across the board.
"Only about 5% of users are on the app, but they generate around 50% of sales."
-- Narasimha Pinnelli, Architect at Junior Couture
That stat from Junior Couture is worth sitting with. A small percentage of your user base, your most loyal customers, can generate an outsized share of revenue when they have a native app to shop from.
This is something we see consistently - the share of a brand’s revenue that comes on the app is significantly higher than the share of customers using it.
Some examples:
- Pharmazone: 63% of online revenue from their app.
- Kiokii: 10% of their customer base using the app, generating 35% of total online revenue.
- Tadashi Shoji: 18% of total online revenue from their app.
Your app doesn't need mass adoption to deliver meaningful ROI. It needs to reach the right customers.
Push Notification Revenue
Unlike every other metric on this list, push revenue is directly attributable. It’s not an argument of “you’re just moving sales from the website to the app”.
You send a push, a customer taps it, they buy something. That's a clean attribution path that even your most skeptical analyst will accept.
Across brands studied in MobiLoud's ecommerce benchmark report, abandoned cart push notifications alone generate between $10K and $200K per month. Pharmazone sees a 22% conversion rate on abandoned cart pushes, recovering five figures monthly from carts that would otherwise be lost.
Push campaigns typically deliver 3-5% click-through rates, which is 3-5x higher than email. And because push notifications are a zero-cost channel after setup (no per-message fee like SMS), every dollar of push-driven revenue drops almost entirely to your bottom line. Think of it as a free version of SMS, as PetShop.co.uk's founder puts it.
How to measure it: Use UTM parameters on all push notification links. Klaviyo, OneSignal, and most push providers offer built-in revenue attribution. Track push-attributed revenue as its own line item in your monthly reporting. For a deeper look at the economics, see our breakdown of the economics of push notifications.
The Indirect ROI (What Doesn't Show in a Dashboard But Moves the Needle)
Not every form of value shows up in a GA4 report. These metrics are harder to attribute directly, but they matter (especially when the core of your argument comes from real, attributable revenue, as discussed above).
Avoided Acquisition Cost
You've already seen that app users buy more often. The indirect value of that is the acquisition cost you don't have to spend to replace churned customers.
Think about it in concrete terms: if your customer acquisition cost is $40 and your app keeps even 500 customers from churning per year, that's $20,000 in avoided acquisition spend, before counting the revenue those retained customers generate. Rainbow Shops sees a 7x higher mobile customer lifetime value from app users, which means each retained app user is worth seven times more than the cost of their retention.
This won't show up as a line item in your app revenue report. But it shows up in your overall CAC efficiency and your LTV-to-CAC ratio, which are numbers your finance team is already tracking.
Reduced Dependence on Paid Channels
Every push notification you send is a message you didn't have to pay for. There's no per-message cost (unlike SMS at $0.01-0.05 per message), no algorithmic throttling (unlike email deliverability), and no ad spend required.
For a brand sending 100,000 SMS messages per month at $0.02 each, that's $2,000/month or $24,000/year. If even a fraction of those messages shift to push notifications, the savings add up quickly, and the engagement rates are typically higher.
This isn't about replacing email or SMS entirely. It's about adding a zero-cost channel that reaches your most engaged customers with near-instant delivery and higher visibility. For more on how push compares to other channels, see our push vs email comparison.
Brand Presence and Home Screen Real Estate
This is the hardest metric to quantify, but it's real. When your app icon sits on a customer's home screen next to Amazon, Instagram, and their banking app, you occupy mindshare that no amount of retargeting ads can buy.
Consumers spend 201.8 minutes per month in shopping apps compared to 10.9 minutes on mobile websites. When the app is there, they’re going to use it.
You’re making it easy for them. You’re staying present, 24/7. It’s like an always-on display ad, with one-tap entry to your store.
Part of this shows up in session frequency. But the mindshare is worth even more than that. It’s what drives long-term customer retention.
How to Present Mobile App ROI to Your Board
Having the data is one thing. Presenting it so that finance and leadership approve the investment (or the continued spend) is another. Here are the four frameworks that tend to work.
The Cohort Comparison
The simplest and most compelling approach. Take two groups of customers over the same 90-day period: app users and non-app users. Compare their behavior side by side.
Sample data based on MobiLoud benchmark averages. Your numbers will vary, but the direction is consistent.
This table does most of the talking for you. When a board member sees a 6x difference in revenue per user, the conversation shifts from "should we invest?" to "how fast can we scale adoption?"
The Revenue Attribution View
Show what percentage of your total online revenue flows through the app. Present it as a new revenue stream, not a redistribution.
Brands on MobiLoud typically see 10-30% of total online revenue come through their app, with high-performers reaching 50-60%. Some examples:
- Pharmazone: 63% of online revenue from the app
- Kiokii: 35% of online revenue
- Freedom Rave Wear: 20-30% of total revenue
- MASC: 20% of total online revenue
- Tadashi Shoji: 18% of total online revenue
The question your board will ask: "Is this incremental, or is it just shifting from the website?" The short answer is that it's a mix, but the behavioral data supports real incrementality.
App users visit more often, convert at higher rates, and spend more per order. Even conservative estimates typically show that at least 25-50% of app revenue is net new.
The Payback Period
This is the slide that gets finance teams to nod. Show how quickly the app pays for itself.
Monthly app cost divided by incremental monthly revenue equals payback period. For a brand doing $10M+ in annual revenue, the payback period could be measured in weeks, not months.
Of course, that depends greatly on how much you spend on your app, too. We'll break down the specific math in the next section.
The Opportunity Cost Frame
Sometimes the most persuasive argument isn't what you'll gain; it's what you're leaving on the table.
Only 4.56% of US ecommerce brands with $100K+ monthly revenue have a mobile app. Meanwhile, your customers are trained by Amazon, Sephora, Nike, and every other major retailer to expect an app experience. The question isn't whether your customers want an app. It's whether they'll keep choosing you without one.
Pair this with a stat on mobile app engagement vs mobile web to show the gap between where your customers spend their time and where your brand currently shows up.
Why the Math Almost Always Works
Here's the part most ROI articles skip: the denominator matters as much as the numerator.
If you're spending $250,000+ on a custom native app build with a 9-12 month timeline and an ongoing development team, the ROI bar is high. You need significant revenue just to break even.
But if your investment is a fraction of that, with no development team and no rebuild, the equation tilts dramatically in your favor.
With a service like MobiLoud, your investment is insignificant, compared to the potential return.
MobiLoud lets you launch custom mobile apps, built on top of your existing tech stack. Your full checkout, your loyalty program, your integrations, everything works from day one because it's powered by the same site your customers already use. The total cost is predictable: a monthly fee (starting at $1,499/mo, or $1,274 on annual billing), which is meaningfully more affordable than the cost of mobile devs working full-time on your app.
That changes the ROI math entirely. Here's what it looks like at different revenue levels:
Assumptions: 25% of total revenue flows through the app (based on MobiLoud benchmarks showing a 10-30% range). 50% of that app revenue is net incremental. Gross margin of 45%, which is typical for DTC ecommerce. MobiLoud cost of $1,274/month with annual billing discount ($15,288/year).
These figures are relatively conservative, but still show the app is a no-brainer.
A $20M brand generates nearly $92,000 per month in incremental gross profit from a $1,274 monthly investment. That's a ~74x return, every month.
Even if you cut every assumption in half, 12.5% of revenue through the app and only 25% of that being incremental, the ROI for a $20M brand is still over 18x. The math is almost impossible to break.
"The expense isn't that big...it's a no-brainer."
-- David Cost, VP of Ecommerce, Rainbow Shops
And this doesn't account for the indirect value: reduced SMS spend, higher retention, increased lifetime value, or the brand equity of having your icon on your customers' home screens. Those are real economic benefits that make the actual return even higher than the table shows.
To see what the numbers look like for your specific revenue level, try MobiLoud's ecommerce app revenue calculator.
The biggest risk with a mobile app isn't that it won't deliver ROI. It's waiting too long to find out. Every month without an app is another month where your most loyal customers are shopping through a mobile browser instead of a native experience that keeps them coming back.
If you want to see what the numbers look like for your brand specifically, book a free strategy call.
We'll run the math with your actual revenue and traffic data, no commitment, no generic benchmarks. Just a clear picture of what your app could deliver.
FAQs
Convert your website into a mobile app