Real data on ecommerce mobile apps
See what real ecommerce brands are getting from their mobile apps. We pulled together benchmarks on revenue, conversion rates, AOV, push notifications, retention and more, so you can see the impact an app could have for your brand.
What you’ll learn
We put together 56 pages of real data, covering industry-wide benchmarks and real case studies from MobiLoud users.
Conversion rate, AOV, revenue per user, purchaser rate and engaged sessions; see how apps perform in comparison to your other channels.
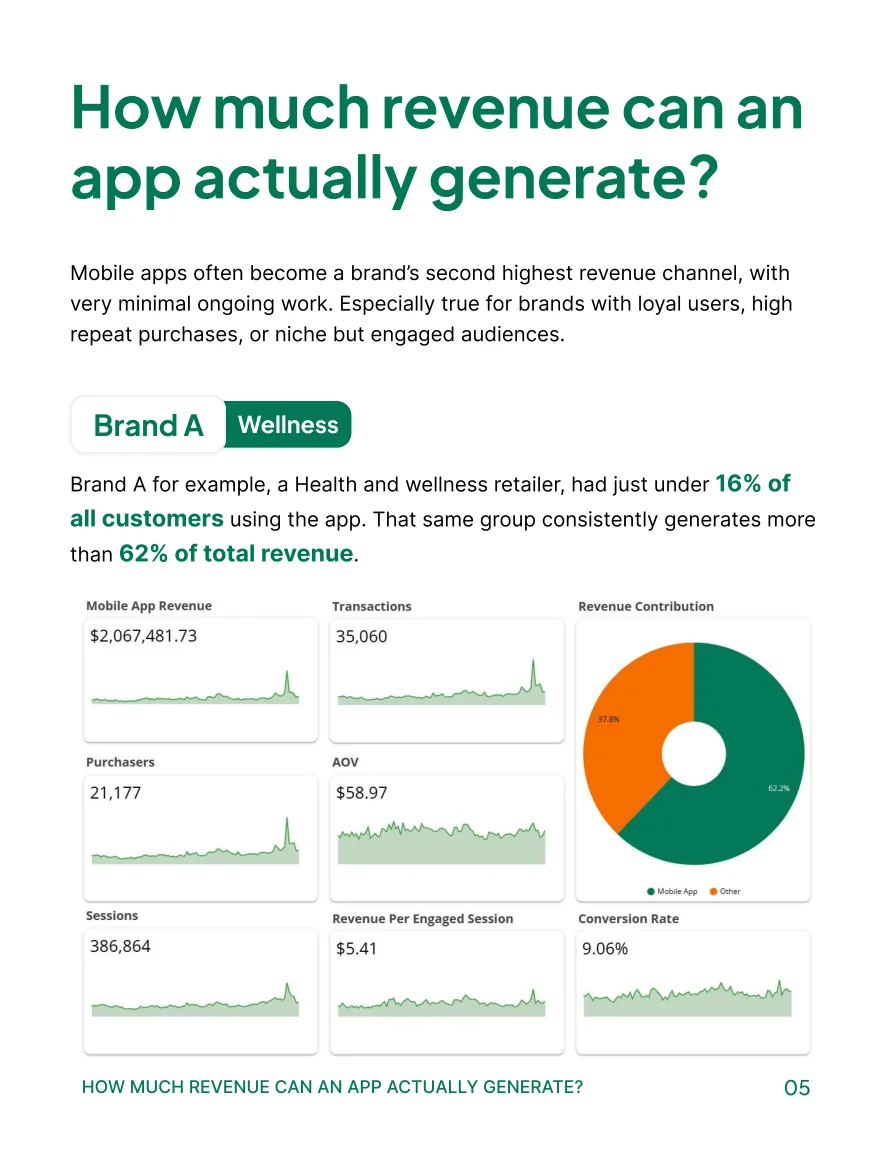
See how one wellness retailer’s app came to serve 16% of its customers and 62% of its revenue.
Benchmarks and revenue potential for push notifications, including the one automation that drove $360K in a single month for one brand.
Learn the ROI potential of mobile apps: expected return modeled against the average cost.
Repeat visits, session length, retention and lifetime value, measured against web-only shoppers.
Adoption, engagement, conversion, ROI and push benchmarks compiled from 18 external sources.
Case study #1
See the results one brand saw, over one quarter’s worth of data studied for the report.
| Metric | Mobile app | Mobile web | Lift |
|---|---|---|---|
| Average revenue per user | $25.27 | $0.73 | 34.6x |
| Average order value | $97.85 | $63.83 | 1.5x |
| Purchaser rate | 25.9% | 1.2% | 21.5x |
| Conversion rate | 9.1% | 1.1% | 8.0x |
| Engaged sessions per user | 4.7 | 1.1 | 4.3x |
Get the same breakdowns for other brands in the report
We pulled real data for brands across several industries, including fashion, cosmetics, and health & wellness, over one (non-holiday) quarter.
See each brand’s real metrics, the lift they’re getting from their app, and how app users shop differently to regular shoppers.
The full contents
Every question we answer, and every benchmark we put behind the answer.
The ones brand operators actually put to us, each answered with real app data.
Industry-wide figures compiled from 18 external sources, including Emarketer, Statista, AppsFlyer, Shopify, Omnisend and Business of Apps.
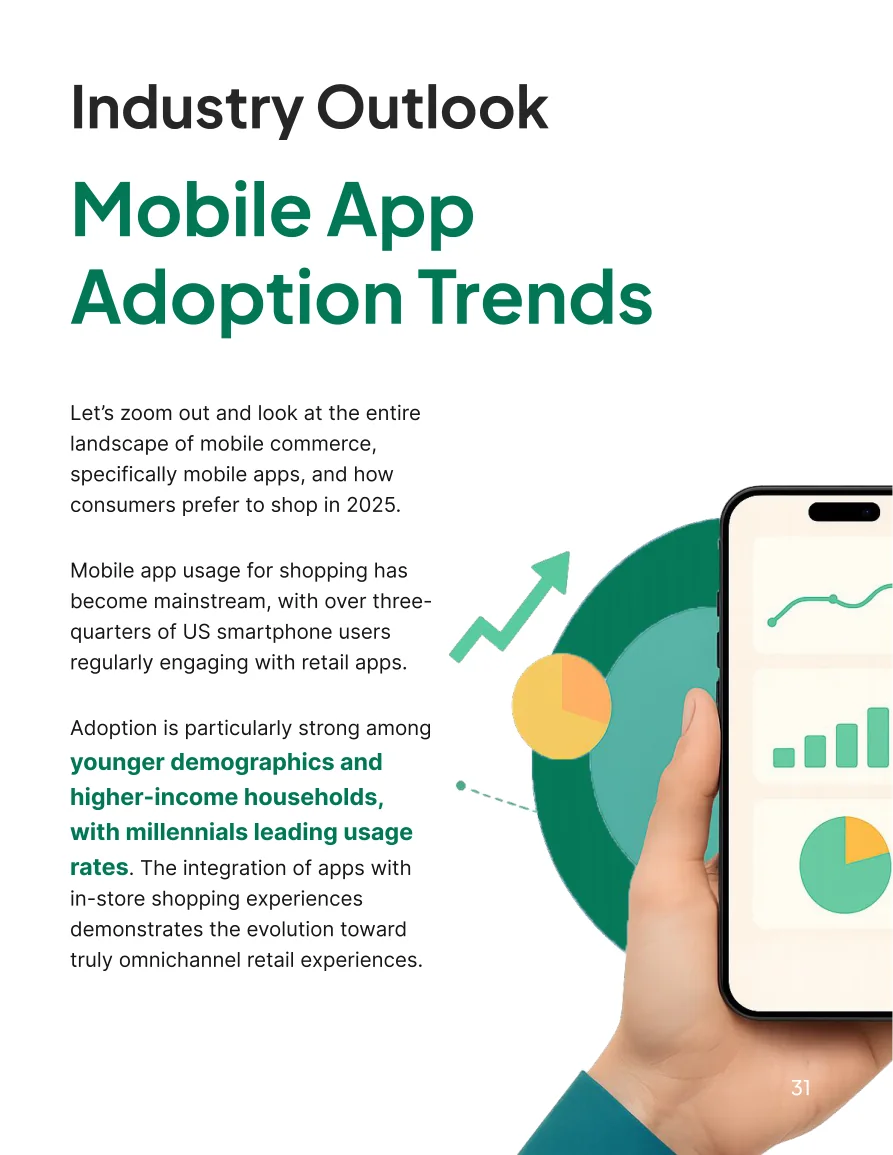
Mobile app adoption trends
Who is using retail apps, in which categories, and how brand-side adoption actually breaks down by revenue band.
Engagement metrics
Time in app, sessions per month and browsing depth, against mobile web and desktop.
The conversion impact of apps
Conversion rate, average order value and cart abandonment across all three channels.
Revenue and ROI
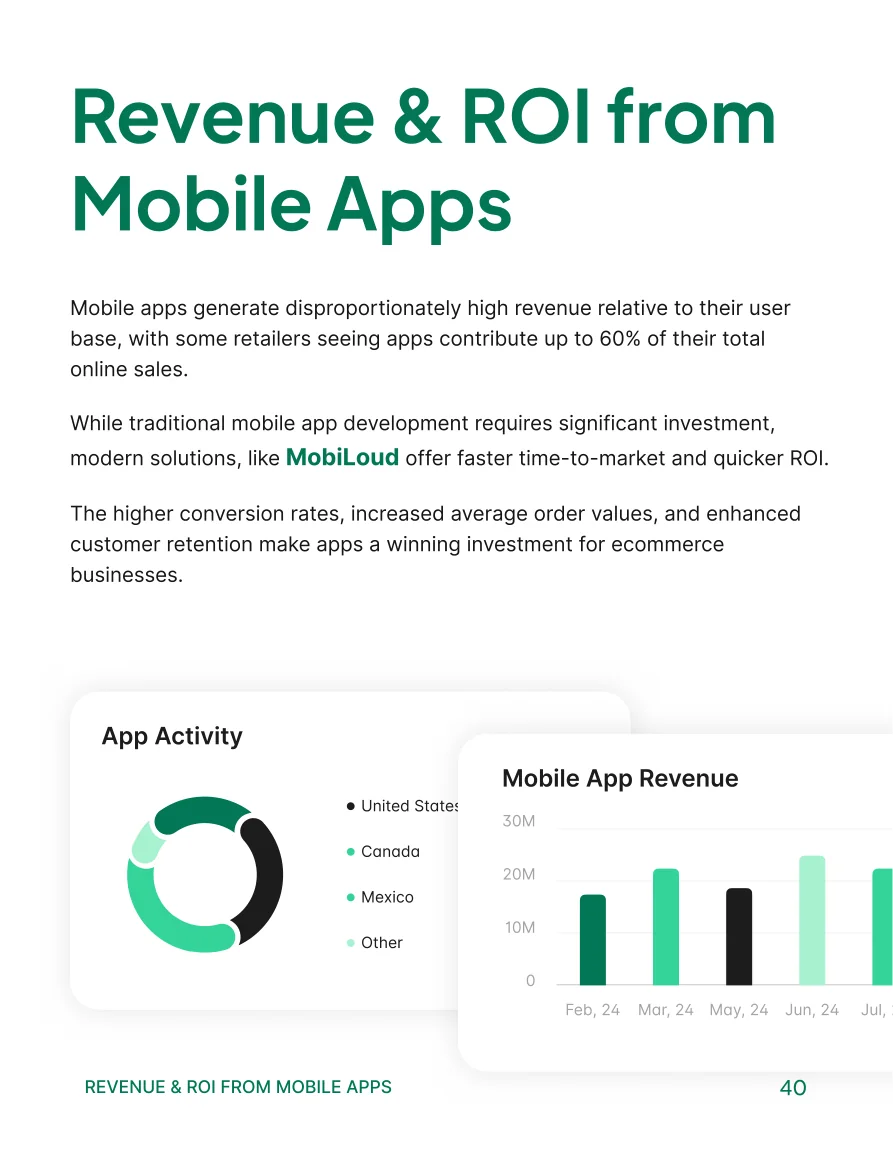
What apps contribute to online sales, what they cost to build and run, and how long the payback takes.
Retention and lifetime value
Repeat purchase rates, retention multiples, and the LTV gap between app and web-only customers.
Push notifications
CTR and conversion by notification type, frequency and timing benchmarks, revenue attribution.
Promotion and growth
Cost per install benchmarks and the website tactics that convert visitors into app users.
Trends and predictions
Where mobile commerce is heading, and what first-party data means after ATT and third-party cookies.
A look inside
Everything in the report is rooted in real data, pulled from the dashboards of real brands, presented in an easy to read breakdown.
About MobiLoud
MobiLoud lets you launch full-featured iOS and Android apps, powered by and fully synced with your existing website.
There’s no second codebase to maintain, no new team to manage. Your current team runs everything, through whatever web platform you’re already comfortable with.
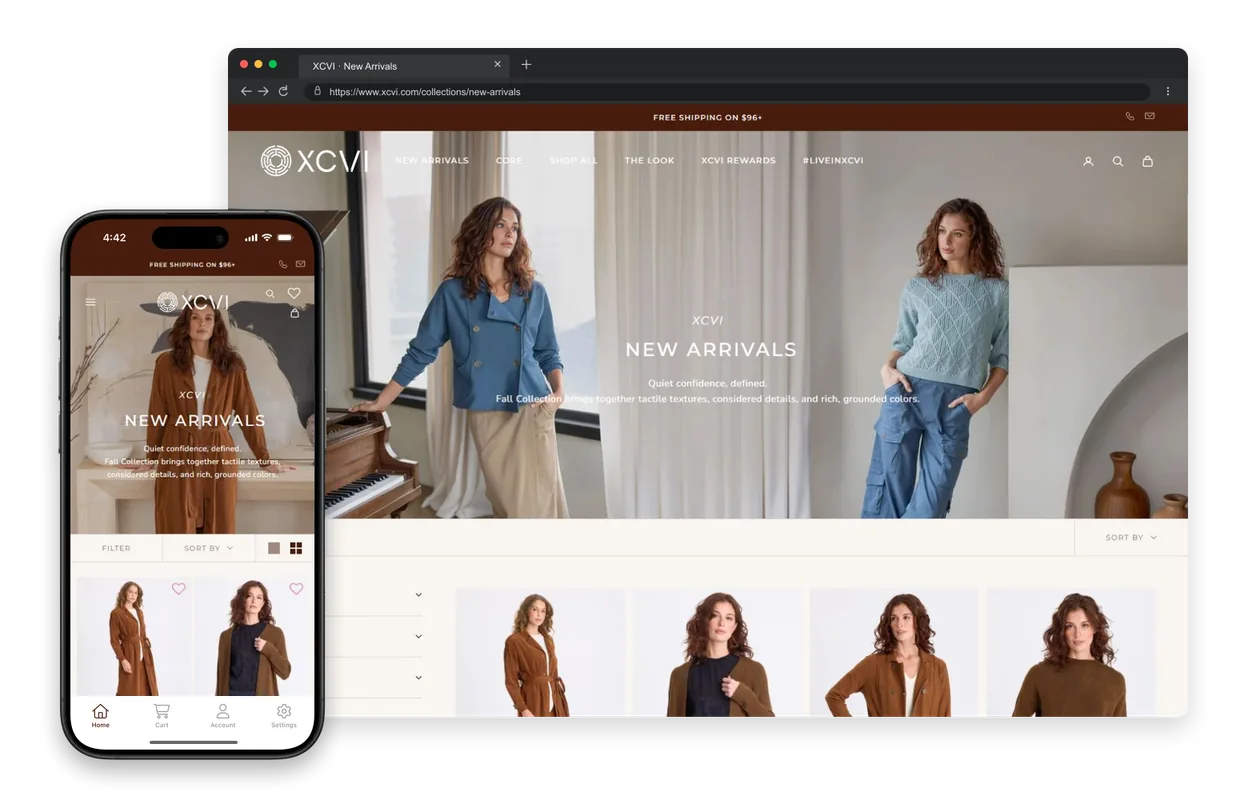
We’ve published more than 2,000 apps since 2013, for brands including Jack & Jones, John Varvatos and Tadashi Shoji. We’ll show you what your app could look like, on a 30-minute call where you can get the complete picture of what an app could do for your business.
56 pages of real data you won’t get anywhere else.

