32+ Ecommerce Mobile App Statistics (The Business Impact of Mobile Apps)

Customer acquisition costs are climbing, putting a squeeze on margins. Email and SMS channels are more crowded than ever, making it harder to retain your best customers.
For ecommerce brands looking to drive sustainable growth, the answer isn't spending more on ads. It's building stronger relationships with existing customers.
Mobile apps have quietly become the ultimate retention engine for ecommerce brands. They're driving high-margin sales, and powering high-LTV customer segments. And they work across almost every category.
Our team broke down the data. We created a report based on 30+ industry sources, as well as our own internal data, to show the business impact of mobile apps.
Here’s all you need to know about the state of mobile apps in ecommerce today.
Get the full picture on how mobile apps drive real results for ecommerce businesses. Download the 2025 Ecommerce Mobile App Benchmark Report.
The Mobile App Market Is Massive (And Growing)
The market for shopping apps is growing fast.
76.5% of US smartphone users (roughly 164 million people) regularly use shopping apps, with 78% of consumers worldwide embracing mobile app shopping.
This isn't just casual browsing. It's a major behavior shift:
- Users spend 201.8 minutes per month in shopping apps versus just 10.9 minutes on mobile websites
- 56% of global consumers shop on mobile at least once a week
- Higher-income households show 82% adoption rates for shopping apps
- Millennials lead usage rates, with 61% having downloaded retail apps and 58% preferring to purchase via apps
The engagement numbers tell a compelling story about user intent. When someone downloads and uses a shopping app, they're not just browsing. They're actively looking to buy.
Revenue Contribution: Small Segment, Outsized Sales
Here's where the data gets really interesting.
We analyzed real ecommerce brands across various industries to see what kind of revenue their apps actually generate.
The results showed an outsized contribution from app users every time.
- Brand A (Wellness): Just 16% of all customers used the app, but they generated 62% of total revenue.
- Brand B (Fashion): Only 7% of traffic came from app users, but they drove 20% of all revenue.
- Brand C (Cosmetics): 10% of all users were on the app, yet they contributed 15% of sales.

This pattern holds across industries.
Our research shows that retail and ecommerce brands typically see 10-30% of their total online revenue coming through their apps, with high-performers hitting 40-60% of online sales from their app channel.
The math is simple. Not every shopper will download an app. But those who do are almost guaranteed to spend more.
Even with a smaller user base, apps consistently punch above their weight when it comes to revenue generation.
Engagement & Habit‑Building
Mobile apps excel at creating regular shopping habits. App users don't just convert more – they come back more often and engage more deeply.
Here are some patterns we saw from brands we studied:
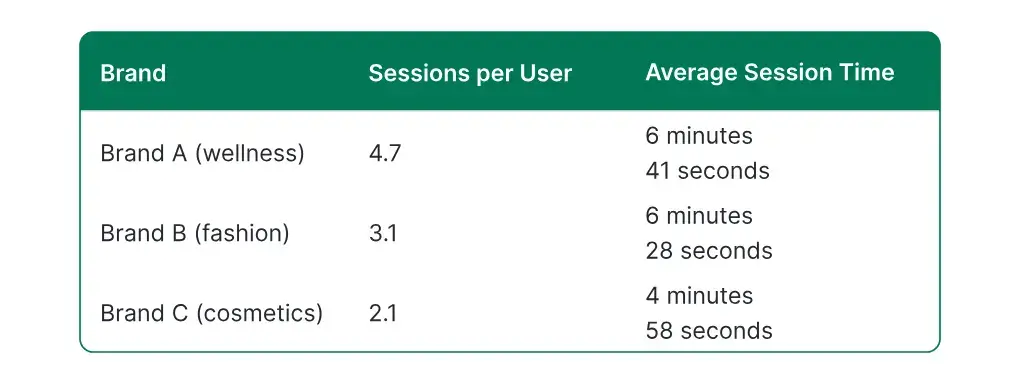
- Brand A users: 4.7 sessions per month, averaging 6 minutes 41 seconds each
- Brand B users: 3.1 sessions per month, averaging 6 minutes 28 seconds each
- Brand C users: 2.1 sessions per month, averaging 4 minutes 58 seconds each
Compare this to mobile web users who typically spend 1-2 minutes per session. App users spend 3-7x longer per session, exploring products, reading reviews, and making purchase decisions.
They also view approximately 4.2x more products per session than mobile web visitors. Indicating much deeper engagement with your catalog.
Mobile App Conversion Rates
The conversion data reveals why apps are such powerful revenue drivers.
Across every brand we studied, app users converted at much higher rates:
- Brand A (Wellness): 9.1% app conversion vs 1.1% mobile web (8x higher)
- Brand B (Fashion): 2.6% app conversion vs 0.2% mobile web (11x higher)
- Brand C (Cosmetics): 2.8% app conversion vs 1.5% mobile web (1.9x higher)

These aren't small improvements. They represent clear differences in how customers behave when they have a dedicated app experience versus browsing on mobile web.
Average order values are also higher in apps.
Our data found mobile app AOV typically 10-50% above mobile web. While industry reports show app users spend about $95 per order versus $73 on websites.
Ecommerce Push Notifications
Push notifications alone can justify building an app.

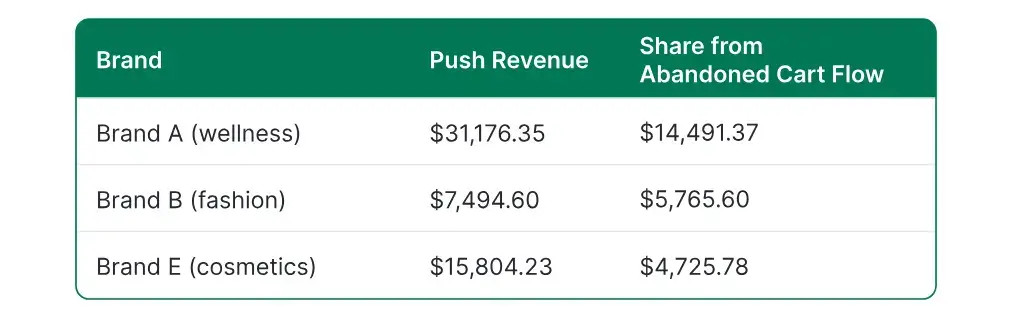
Our data shows abandoned cart push campaigns generating substantial revenue with minimal effort:
- Brand D (Cannabis Retailer): Recovered over $360K in a single month through abandoned cart push notifications alone.
- Brand A (Wellness): Generated $14K+ monthly from automated cart recovery.
- Brand B (Fashion): Recovered $5.7K monthly.
- Brand E (Cosmetics): Recovered $4.6K monthly.
Push notifications consistently outperform other channels:
- Click-through rates of 3-5% (3-5x higher than email)
- Conversion rates of 1.5-4%
- Up to 10x higher revenue per user compared to email and SMS
The best part? These are automated flows that run in the background once set up.
No ad spend, no manual campaigns. Just recovered revenue from customers who were already interested enough to add items to their cart.
Learn more: All You Need to Know About Push Notifications for Ecommerce
Mobile App ROI & Cost Economics
Traditional mobile app development used to require massive investments – $100,000-$250,000 and 10-13 months to launch.
But modern web-to-app solutions have changed the economics entirely.
Here are some real ROI examples from Q1 2025:
- Brand A: $2.07M app revenue contribution, $4,500 quarterly cost = 459x ROI
- Brand B: $194K app revenue contribution, $1,800 quarterly cost = 108x ROI
- Brand C: $1.82M app revenue contribution, $6,000 quarterly cost = 303x ROI

With managed solutions like MobiLoud, brands can go live for as little as $1-2K upfront.
Abandoned cart notifications, on their own, can easily generate $10K+ in revenue per month - which would drive a 5-10x ROI.
When you consider that abandoned cart revenue only makes up around 10% of total mobile app revenue, that gives you an idea of the how high your mobile app's ROI can scale.
Want to see how you can launch your own, high-ROI mobile app? Get a free preview of your app now.
Retention & Lifetime Value
App users don't just buy more initially. They become more valuable customers over time:
- Customer lifetime value is 2.8-5x higher for app users versus web-only shoppers
- 60% of first-time app buyers make at least one additional purchase
- App users purchase approximately 33% more often than non-app users
- 60% of app customers make multiple purchases in a year, compared to only 40% of mobile website customers
This retention advantage compounds over time, making the initial investment in an app increasingly valuable as your customer base grows.
The Competitive Landscape (How Many Brands Have Apps?)
Despite the clear benefits, most brands haven't adopted mobile apps yet.
Our research shows:
- Only 4.56% of US brands with $100K+/month revenue have mobile apps
- Just 3.37% of Shopify brands with $50K+/month revenue have apps
- Ecommerce brands with custom-built websites are 2x more likely to have a mobile app
This represents a significant opportunity for early movers. The cost to acquire app users is also relatively low – $3-4.50 per install for retail apps – often cheaper than other customer acquisition channels.
Learn more: How Many Ecommerce Stores Have Mobile Apps?
Ecommerce Mobile App Trends to Watch (2025‑2026)
We’ve seen the current state of mobile apps for ecommerce. But how about the near future?
Here are a few trends emerging in the world of mobile apps and ecommerce.
The First-Party Data Advantage
As third-party cookies disappear and Apple's tracking limitations expand, brands need direct relationships with customers.
Apps provide first-party data and zero-party data collection opportunities.
Expect more brands to see the value in mobile apps, not just for driving sales, but for collecting crucial data on their customers.
Enhanced Experiences
AR try-on features, AI-driven personalization, and social commerce "feed" experiences are becoming standard expectations for mobile shopping.
Watch brands build more innovative apps, utilizing these features to build immersive shopping experiences.
Omnichannel Integration
Apps increasingly connect online and offline experiences, with 74% of consumers worldwide using retail apps while shopping in physical stores.
Apps aren’t just a better way to shop online. They’re becoming a powerful asset for the physical retail CX as well.
The Bottom Line
Mobile apps can generate up to 7x more revenue per user and contribute 40-50% of online sales for ecom brands.
They build stronger customer relationships, drive higher conversion rates, and create automated revenue streams through app-only features like push notifications.
The data is clear. While not every website visitor needs your app, your best customers absolutely do.
Apps provide a superior experience for your most valuable shoppers while giving you direct access to re-engage them.
For brands serious about sustainable growth and customer retention, the question isn't whether to build an app. It's how quickly you can launch it.
Ready to get the full picture? Download the complete 2025 Ecommerce Mobile App Benchmark Report for everything you need to know about the performance of mobile apps in ecom & retail, based on real brand data.
FAQs
Convert your website into a mobile app