The Mobile App Impact on BFCM 2025: Key Stats & Trends

Black Friday/Cyber Monday is evolving.
It’s no longer a short sprint lasting a few days. And it’s getting harder to drive consistent returns from traditional engagement and retention channels.
What hasn’t changed is its importance. BFCM is still one of the most important blocks on the ecommerce calendar, with the potential to generate momentum brands can carry into the new year.
This BFCM, we analyzed results from 100+ shopping apps, including MobiLoud customers and other popular DTC apps, to understand how brands approached Black Friday; particularly through mobile apps, one of the most underutilized yet consistently overperforming ecommerce channels.
A few patterns stand out:
- The BFCM window is stretching longer
- Push notifications are emerging as a secret weapon for busy promo events
- Apps move the needle in real way, for a number of key revenue metrics
Let’s dive deeper now. Here’s what we learned:
The BFCM Promo Window
We studied 87 popular shopping apps over the BFCM period, primarily independent DTC brands across categories including fashion, beauty, home & kitchen, food & beverage, supplements, and luxury.
The first notable takeaway was that 75% of brands (65 of 87) were running BFCM promos in full-swing on Monday the 24th (the Monday prior to Black Friday).
Black Friday/Cyber Monday is no longer Friday-Monday. The window is stretching, with brands looking to gain visibility when there’s less competition for attention.
Opting out of BFCM?
By Cyber Monday (December 1), 93% of brands (81 of 87) were running a BFCM promotion in their app.
Two things stand out:
- The share of brands running early BFCM promotions is even higher when excluding those that skipped the period entirely.
- It suggests that a small but notable group (just under 10%) appeared to opt out of BFCM in their app altogether.
In several cases, brands ran BFCM promotions on their website but not in their app.
That usually points to one of two issues:
- The app was deliberately excluded from the promotion
- The app experience is out of sync with the website, often due to neglect
Either way, the takeaway is the same: many brands still aren’t fully utilizing their apps during the most important sales period of the year.
And as a channel, there’s still a lot of untapped potential.
Push Notifications: the Secret Growth Lever
How many emails and promotional SMS did you get this Black Friday?
Answer: a lot.
Brands with mobile apps have access to a different channel - less saturated and often more effective during high-intent moments: push notifications.
.avif)
Less than 5% of successful ecommerce brands have their own apps. And among those brands, many still aren’t sending push notifications frequently.
This matters because the ROI on push notifications is incredible.
- Zero cost to send
- Near guaranteed visibility (shows up on the customer’s lock screen)
- Minimal friction to purchase (one tap brings the customer straight into the app)
We wanted to see how brands were using push over the BFCM period; how many brands are using push, what they're sending, and how the frequency differs from a normal period.
That’s why I personally sacrificed my lock screen for two weeks, receiving over 1,000 push notifications, and collating the results.
What we saw in the data
During the core BFCM week (Nov 24-30):
- 8 brands sent an average of 2 or more push notifications per day
- 6 brands sent 20+ notifications across the week
- The most aggressive sender pushed 44 notifications in one week
- The average brand sent 8.6 notifications that week
- The median was 7 notifications, compared to a typical baseline of ~3-5 per week
After Cyber Monday (Dec 1-7):
- Only 5 brands maintained an average of 2+ pushes per day
- Just 3 brands sent 20+ notifications
- The top sender dropped from 44 the previous week to 35
- Average volume fell to 7.15 notifications
- Median dropped to 5.5, only slightly above normal levels
Crucially, nearly 20 brands weren’t sending push notifications at all during BFCM.
That’s a major growth lever, and as many MobiLoud customers have told us, the number one reason to launch an app, not being used.
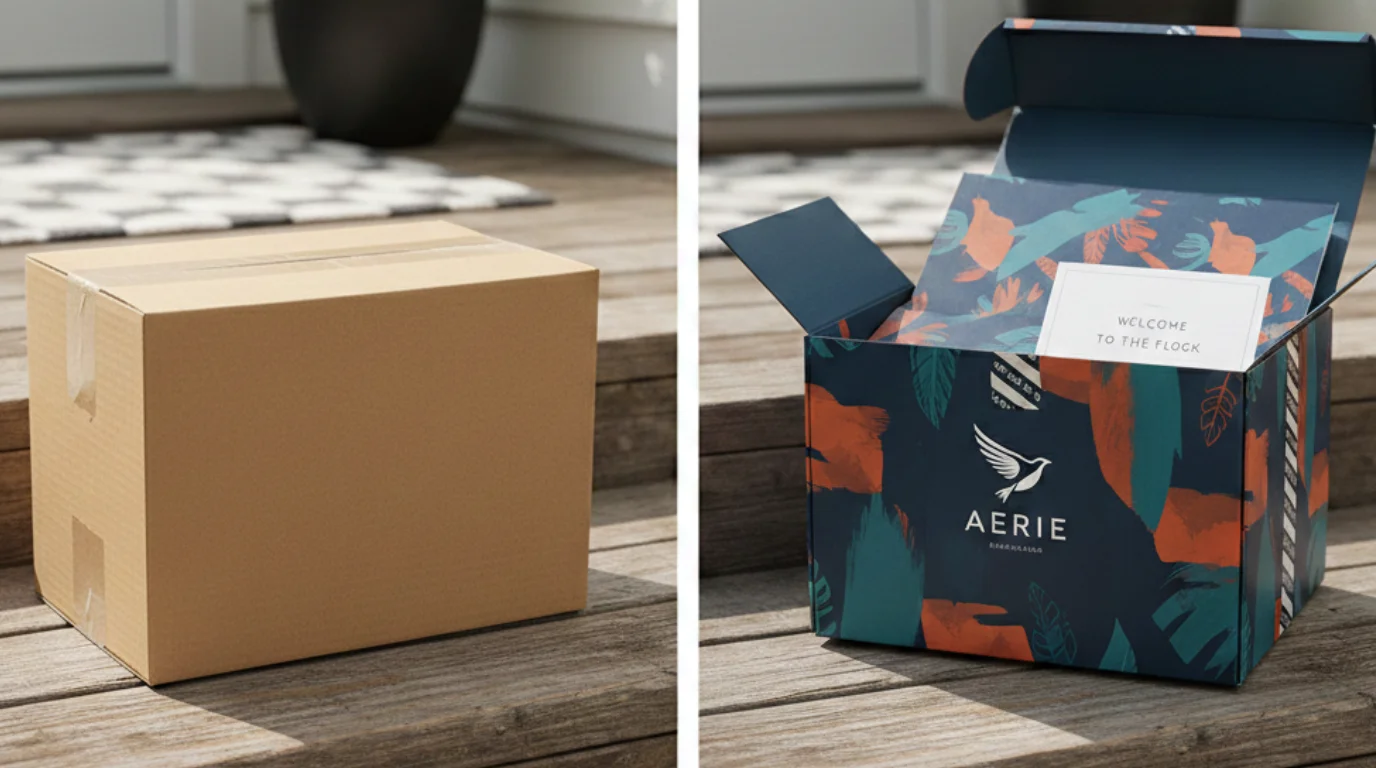
The biggest missed opportunity
The bigger miss is not the brands who aren’t using push at all. It’s those who are, but don’t have one core flow set up.
Only 26 of the brands we studied were sending abandoned cart notifications.
Abandoned cart notifications automatically follow up with app shoppers who leave an item in their cart, unpurchased.
They get a notification right on their lock screen, and one tap brings them back into the app to finish their purchase.
.avif)
This automated sequence takes very little work (zero, after the initial setup), and recovers would-be lost revenue on autopilot.
We’ve seen brands recover over $200,000 in revenue in just 30 days with abandoned cart notifications.
And the impact could be even bigger over BFCM, with more distractions, more chances for the shopper to get pulled away.
We saw this clearly in the data:
- One beauty brand saw a 152% increase in abandoned cart push revenue, while total store revenue rose just 29%. Cart recovery accounted for 83% of their total push revenue.
- One wellness brand recovered over $30,000 from abandoned cart push during BFCM alone; roughly 20% of their total app revenue.
Given the ease of setup and upside, abandoned cart push should be a baseline requirement for any brand running an app, especially during peak traffic periods.
How Mobile Apps Drove Revenue During BFCM
Numerous MobiLoud merchants drove hundreds of thousands in revenue through their apps over the two week extended BFCM period.
We saw consistent lifts across key revenue metrics, from revenue contribution to AOV, conversion rate, and revenue per user.
Here are the highlights.
Higher Revenue & Revenue Contribution
We’re seeing a meaningful share of brands’ overall revenue come through their app during the BFCM period.
In many cases, app revenue grew faster than mobile and overall revenue, showing their promotions are having a stronger impact from their app cohort.
- A fashion brand saw app revenue contribution (percentage of total revenue from their app) increase by 18% compared to the previous period.
- A fashion brand saw app revenue increase by 42% versus the previous period.
- A beauty and fragrance brand saw app revenue increase by 125% (compared to an 81% rise in total mobile revenue).
- A fashion/maternity brand saw app revenue increase by 337% and app transactions increase by 233%.
- A luxury fashion brand saw app revenue increase by 95%, compared to a 44% increase across mobile overall.
- A home decor brand saw app revenue increase by 69% compared to the previous period.
Higher Average Order Value (AOV)
Apps consistently drive larger baskets, not by a few percentage points, but often by 25-100%+, especially in higher-consideration purchases.
This pattern appeared consistently across fashion, beauty, home, and specialty retail.
- A fashion brand saw app AOV of $116.52 compared to $92.85 on mobile web (a 25.5% increase).
- A luxury fashion brand saw app AOV of $533.31 compared to $397.05 on mobile web (+34.3%).
- A beauty and professional supplies brand saw app AOV of $309.48 compared to $144.61 on mobile web (+114%).
- A home decor brand saw app AOV of $94.70 compared to $73.84 on mobile web (+28.3%).
Higher Revenue Per User
Across categories, apps consistently generated significantly more revenue per user than mobile web during BFCM. In many cases, multiple times higher.
- A fashion brand saw app revenue per user of $19.51 compared to $7.11 on mobile web (a 174.4% increase).
- A luxury fashion brand saw app revenue per user of $42.41 compared to $5.41 on mobile web (nearly 7x higher).
- A beauty brand saw app revenue per user of $11.16 compared to $3.08 on mobile web (a 262.3% increase).
- A pet supplies brand saw app revenue per user of $7.92 compared to $2.55 on mobile web (a 210.6% increase).
Higher Conversion Rates
Apps also consistently delivered meaningfully higher conversion rates than mobile web during BFCM.
- A fashion brand saw app conversion rate of 5.31% compared to 2.96% on mobile web (a 79.4% increase, or nearly 1.8x higher).
- A food and beverage brand saw app conversion rate of 5.76% compared to 2.77% on mobile web (a 107.9% increase).
- A pet supplies brand saw app conversion rate of 6.41% compared to 2.16% on mobile web (a 196.8% increase, or almost 3x higher).
- A beauty brand saw app conversion rate of 12.63% compared to 5.92% on mobile web (a 113.3% increase).
It’s worth noting that these apps largely mirror the brands’ websites. There’s no major redesign or feature overhaul.
Yet even small improvements, combined with the self-contained nature of an app, were enough to drive 2-3x higher conversion rates during BFCM.
Push Notification Revenue
Several brands saw large increases in push-attributed revenue, including notable contributions from cart abandonment campaigns.
- A fashion brand saw push-driven revenue increase by 152% compared to the previous period.
- A beauty and fragrance brand saw push revenue increase by 174%.
- A pet supplies brand saw push revenue increase by 260%.
- A wellness brand generated over $30,000 from cart abandonment push notifications, representing roughly 22% of total app revenue.
App User Growth & Engagement
In addition to revenue metrics, brands also saw growth in app usage and engagement. This included increases in new app users as well as longer session durations compared to mobile web.
- A fashion brand saw new app users increase by 168% over the period.
- A fashion brand saw new app users increase by 85% compared to the previous period.
- A luxury fashion brand saw average app session duration of 5 minutes 45 seconds versus 2 minutes 55 seconds on mobile web.
Overall BFCM performance summary: apps vs mobile web
Here’s an overall look at how our brands achieved better results during the promotional period (measured from Nov 23 - Dec 5).
- 25-35% higher average order value (AOV) from app users, with some categories seeing lifts of 100%+.
- 2-7x higher revenue per user.
- 80-115% higher conversion rates vs mobile web (in several cases 2-3x higher).
- App session duration often 60–100% longer.
- Many brands seeing 150-260% push revenue growth, while new app user growth ranged from 15-85%.
Key Takeaways for Ecommerce Brands
BFCM is still the most important few days on the calendar for any ecommerce brand.
There’s more traffic, stronger intent, and excitement that can be weaponized to drive major revenue.
But the period is getting longer. Competition is getting stronger. It’s becoming harder to stand out, and there’s a bigger swing from brands that do BFCM right, and those who miss the mark.
At a time when attention is more abundant, but also harder to secure, having a mobile app gives you a powerful leg up.
You get a more direct connection with your best customers; a shopping experience that’s your brand, and nothing else; and push notifications, still the most underutilized channel in ecommerce.
BFCM 2025 has just finished, but you can (and should) start planning already for BFCM 2026.
That means, if you haven’t already, launching your own mobile app. MobiLoud is the most straightforward way to do it. No rebuilding, no templates, no duplicate work to keep your website and mobile app in sync.
If you want to see what your app could look like, get a free preview now - or book a free consultation to talk it over.
FAQs
Convert your website into a mobile app