57 Mobile App Download, Usage and Revenue Statistics for 2026

If you've launched a mobile app, planning to launch an app, or just have an interest in the mobile app market, this article is for you.
We're going to share a curated list of the most insightful, interesting, up-to-date mobile app statistics. These statistics give you everything you need to know about how we use our mobile phones - and in particular, mobile apps. You'll see how massive the mobile app market is, how much money is flowing around, and how mobile apps have become an indispensable part of life as we know it.
Highlights
There's a wealth of data coming up. First, here’s a snapshot of the most fascinating app statistics we found:
- The number of apps available for download worldwide has increased by 82% since 2016.
- The average American checks their phone 262 times per day.
- People spent 3.8 trillion hours on mobile apps in 2022.
- 2.6% of people will still be using an Android app 30 days after they download it. For iPhone apps, it’s 4.3%.
- Mobile apps are on track to generate $932 billion in revenue in 2023.
- 2 million new apps were launched in 2021 alone.
- In 2021, $320,000 was spent every minute in the app stores.
Now let’s get into the most interesting and worthwhile app statistics on the following topics:
- Smartphone & tablet usage
- Mobile app downloads
- Mobile app usage
- App stores
- Mobile app revenue
- The overall market for mobile apps
App developers, app users, app enthusiasts, and anyone simply curious about the world around you, keep reading for more.
6 Smartphone & Tablet Statistics
We can start by looking at how mobile devices dominate our lives today.
- There are more than 6.5 billion smartphone users worldwide today. [Statista]
- This number is projected to reach 7.7 billion by 2027. [Statista]
- There are over 1.3 billion tablet users worldwide. [Statista]
- Mobile holds approximately 60% market share over desktop, which has 38%. The tablet market share is steady at 2%. [Statcounter]
- The average American spends 2 hours and 54 minutes on their phone each day, and checks their phone 262 times per day. [Reviews.org]
- 87% of millennials have their smartphone at their side day and night. [Google]
Takeaways
The key takeaway from this data is that modern consumers are mobile-first.
Mobile holds around 60% market share today. We're glued to our mobile devices. We spend nearly 20% of the time we're awake on our phone, and check our phone hundreds of times a day. And smartphone usage is only going up.
Smart businesses meet their customers where they are. Today, that's on mobile.
4 Mobile App Download Statistics
- There are 255 billion mobile apps downloaded worldwide each year. [Statista]
- Between 2016 and 2022, there has been an 82% increase in the number of apps downloaded per year. [Statista]
- Combined, the Apple App Store and Google Play Store have 35-36 billion app downloads each quarter. [Statista]
- Mobile games are the most popular category, with nearly 100 billion downloads per year. Second is mobile photo and video apps, with nearly 20 billion downloads. [Statista]
Takeaways
The number of app downloads per year is staggering. Whether it's from the Google Play Store, the Apple App Store, smaller app stores or direct downloads, it seems we can never have enough apps installed on our phones.
If you want to launch an app, but are concerned that the market is too saturated, the number of app downloads today shows that there is still more than enough demand for new players.
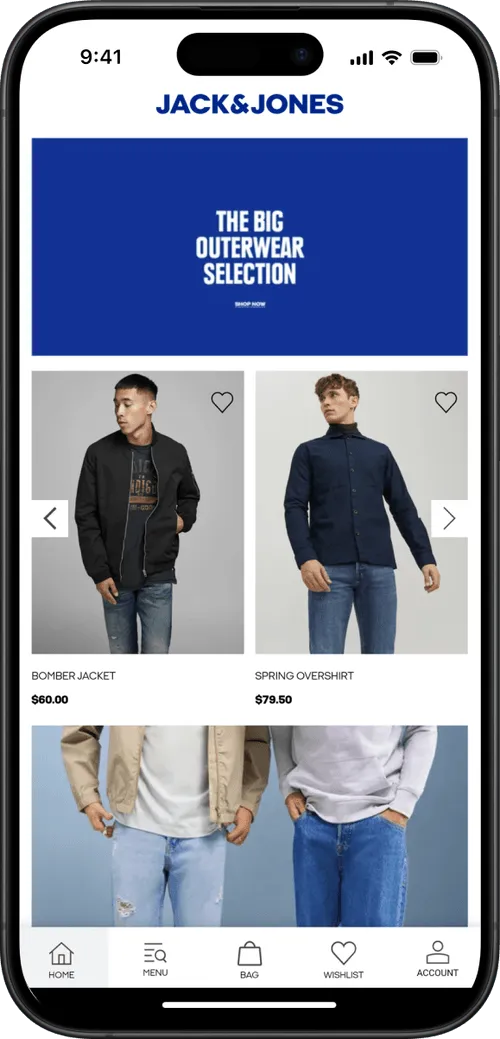
If you're running an eCommerce store, and you don't have an app, you're missing out. Our eCommerce App Revenue Calculator shows just how much your brand can gain from launching your own mobile app.
17 Mobile App Usage Statistics
- Consumers spent 3.8 trillion hours on mobile apps in 2022. [Data.ai]
- 88% of the time we spent on mobile devices is spent using apps [Emarketer]
- The retention rate for Android apps is 22.6% one day from download, 6.5% seven days from download, and 2.6% 30 days after download. [Statista]
- The retention rate for iOS apps is 25.6% one day from download, and 4.3% 30 days after download.
- The app category with the highest share of usage time for US mobile users is social media/communication apps, followed by browsers and mail apps. [Statista]
- 70% of users who switch away from an app do so because it’s too slow. [Google]
- 67% of users will leave an app if there are too many steps to find the information or take the action they need. [Google]
- 61% of people between the age of 18 and 34 want to be able to use apps with only one hand. [ComScore]
- 49% of millennials say the thing they hate the most about apps is when it drains their battery too fast. [Mindsea]
- 37% of millennials say mobile data usage is one of their top three concerns when deciding whether or not to use an app. [Mindsea]
- 54% of millennials have more than 3 screens of apps on their phone. [Mindsea]
- Social networking apps are the most popular type of app with millennials, followed by messaging apps and games. [Mindsea]
- 73% of millennials shop on mobile up to 4x per week. [Tapjoy]
- 70% of millennials play mobile games daily. [Tapjoy]
- Gen-Z users spend an average of 4.1 hours per month in non-gaming mobile apps (10% longer than older generations). [TechCrunch]
- Gen-Z users also have 20% more sessions in non-gaming apps than older groups (120 sessions per month per app). [TechCrunch]
- Mobile app users in China open apps on average 67 times per day, spend an average of 7.56 hours in apps each day, and use an average of 7 apps each day. [Statista]
Takeaways
There's a lot we can take away from these mobile app usage statistics.
The first is simple - we use mobile apps a lot. And younger generations use apps even more, indicating that total mobile app usage will only grow with time.
The retention rate for apps is certainly worth paying attention to for app developers. On average, less than 5% of app downloads will still be using the app 30 days later. If you can't deliver the experience that mobile users expect, they're going to forget your app, fast.
Social media apps, communication apps, and mobile gaming apps are the most popular app categories. But that's not to say there's no room for other types of app.
As 73% of millennials shop on mobile 4x per week, shopping apps have immense potential. As for other app types - entertainment apps, business apps, productivity apps, etc - with more than half of millennials having three screens of downloaded apps, there is more than enough space in the market for different kinds of app.
8 App Store Statistics
- There are more than 3.7 million apps available on the Google Play Store. [42matters]
- Approximately 500,000 apps on Google Play are gaming apps, compared to 3.2 million non-gaming apps. [42matters]
- There are 1.15 million app publishers on the Google Play Store. [42matters]
- Of the apps on Google Play, approximately 3.2 million (85%) are non-gaming apps, while 533,000 (14%) are gaming apps. [42matters]
- The Apple App Store has over 1.7 million apps available for download. [42matters]
- There are 735,000 app publishers on the Apple App Store [42matters]
- Of the apps available on the iOS App Store, approximately 1.5 million (87%) are non-gaming apps, with 214,000 gaming apps (12%). [42matters]
- The Google Play Store is responsible for approximately 77% of all worldwide mobile app downloads. [Statista]
- The Amazon App Store has over 480,000 apps available for download. [Statista]
- The Microsoft App Store (formerly the Windows App Store) has over 800,000 apps. [Windows Report]
Takeaways
The Google Play Store and Apple App Store are the key players in the market, with by far the highest number of app listings and app downloads.
Though there are more apps available on the Apple App Store, the majority of app downloads come from Google Play, which comes from the fact that there are more Android users than iPhone users around the world.
Aside from Apple/Google Play, there are a few smaller players out there, such as Amazon and Microsoft, trying to carve their own piece of the market. But the two big players are still likely to remain the same.
11 Mobile App Market Statistics
- 2 million new apps were launched in 2021 alone. [Data.ai]
- Mobile ad spend amounts to more than $350 billion. [Data.ai]
- There are more than 2.6 billion mobile gaming users worldwide. [Statista]
- The mobile gaming market is expected to exceed $116 billion by the year 2024. [Newzoo]
- The highest number of mobile gaming users are in Asia, with nearly 1.3 billion, followed by Europe (550 million), Latin America (309 million) and North America (207 million). [Statista]
- 94% of iOS apps are free. [Statista]
- 97% of Android apps in the Google Play Store are free. [Statista]
- There are 2.3 million apps available for download on the app stores in China [Statista]
- The number of apps on the app stores in China decreased from 4.5 million to 2.3 million between 2018 and 2022, a decrease of 48%. [Statista]
- The Huawei AppGallery is the top app store in China, with a market share of 44%. [Statista]
- Gaming apps account for 28% of the apps available in China. [Statista]
Takeaways
We know the market for apps is huge, and this data shows how huge it is.
The gaming app market is particularly massive. It generates hundreds of billions in revenue each year, with billions of users around the world.
This market is dominated by non-US users, though, with the largest concentration in Asia, Europe and Latin America.
Other interesting takeaways include how many apps are launched each year - over a million, despite the number of apps already available on the Google Play/Apple App Store.
Finally, take note of how many apps are free, versus paid. 94% of apps on the Apple App Store, and 97% on the Google Play Store, are free apps. We'll spend money in apps, but not on apps.
11 Mobile App Revenue Statistics
- Mobile apps are estimated to generate $935 billion in revenue in 2023. [Statista]
- In 2021, $320,000 was spent in the app stores every minute. [Data.ai]
- Tinder is the leading mobile app in the App App Store by worldwide revenue, with $37 million in revenue. This is followed by TikTok ($35 million), Honor of Kings ($24 million) and Candy Crush Saga ($21 million). [Statista]
- Coin Master is the leading Android app in worldwide revenue, with $48 million. This is followed by TikTok ($40 million), Candy Crush Saga ($38 million) and Roblox ($18 million). [Statista]
- The subscription rate for non-gaming apps, worldwide (the rate at which users purchase a subscription vs the number of downloads) is 5.5%. [Statista]
- There are 38.5 thousand apps in the Google Play Store priced less than a dollar. 26.6 thousand are priced between 1 and 2 dollars, and 2300 are priced between 9 and 10 dollars. [Statista]
- 1.6 million apps in the Apple App Store are priced less than a dollar. 2800 apps are priced between 9 and 10 dollars. [Statista]
- Mobile apps generate the most revenue through advertising, with over $208 billion USD in 2021. In-app purchases are #2, with approximately $185 billion USD in the same time frame. [Statista]
- Paid apps are expected to generate less than $7 billion USD from app purchases by 2026. [Statista]
- 8% of US apps are monetized by being paid apps. 26% are monetized through ads, and 11% monetized through in-app purchases. [Statista]
- 3% of apps worldwide are monetized by being paid apps. 36% are monetized through ads, and 4% monetized through in-app purchases. [Statista]
Takeaways
Even though the majority of apps are free apps, there is a staggering amount of money flying around in the app market.
Global app revenue is in the hundreds of billions, and will soon reach a trillion. Most apps make money through in-app ads, in-app purchases and/or subscriptions, with just a fraction being paid downloads.
That being said, many follow a "freemium" model, which are technically free to download, but users need to pay to get anything meaningful out of the app, or to use it past a free trial period.
These monetization models are still enough to generate a huge amount of cash - over 300,000 per minute in 2021.
Wrapping Up
There you have it - all you need to know about the state of mobile apps in 2026.
Mobile apps are a billion-dollar industry. And since mobile usage and app usage continues to rise every year, so will the value of the mobile app industry.
If you're running a business, the massive mobile app market should be ignored. Your customers almost certainly spend a large amount of their time on mobile device, using apps. It will soon be non-negotiable to meet them where they are, and offer your own mobile app.
Though custom native apps are expensive, the true cost and effort required to build a mobile app for your business is lower than you think. MobiLoud lets you do this by converting your existing website or web app into an app, for a low upfront cost, in less than a month.
MobiLoud is a tech-enabled service that lets you offer a mobile app experience without sacrificing flexibility or breaking the bank.
Just schedule a call with us to see how easy the process is. For little to no work, and minimal expense, you'll have your business in the app stores, driving high engagement and revenue from mobile users, in no time.
References
https://www.statista.com/statistics/330695/number-of-smartphone-users-worldwide/
https://www.statista.com/statistics/377977/tablet-users-worldwide-forecast/
https://gs.statcounter.com/platform-market-share/desktop-mobile-tablet
https://www.reviews.org/mobile/cell-phone-addiction/
https://www.statista.com/forecasts/1262892/mobile-app-revenue-worldwide-by-segment
https://www.data.ai/en/insights/market-data/state-of-mobile-2022/
https://www.statista.com/statistics/268251/number-of-apps-in-the-itunes-app-store-since-2008/
https://42matters.com/google-play-statistics-and-trends
https://www.statista.com/forecasts/1262881/mobile-app-download-worldwide-by-segment
https://www.statista.com/statistics/1010716/apple-app-store-google-play-app-downloads-forecast/
https://www.statista.com/statistics/271103/top-iphone-apps-worldwide-by-revenue/
https://www.statista.com/statistics/271674/top-apps-in-google-play-by-revenue/
https://www.statista.com/statistics/1245570/android-app-retention-rate/
https://www.statista.com/statistics/1248207/ios-app-retention-rate/
https://www.statista.com/statistics/1320770/apps-conversion-rate/
https://www.statista.com/statistics/271109/average-price-android-apps/
https://www.statista.com/forecasts/1324000/global-app-market-revenue-monetization-segment
https://www.statista.com/statistics/1119916/app-monetization-methods-united-states-app-publishers/
https://www.statista.com/statistics/307330/number-of-available-apps-in-the-amazon-appstore/
https://windowsreport.com/state-windows-8-apps-windows-store/
https://www.statista.com/statistics/512112/number-mobile-gamers-world-by-region/
https://mindsea.com/millennials-app-research/
https://docs.google.com/document/d/1VeiNrvZwkHIsVSYxfewAT_vJnzZchi5y3nOAFtBxbNg/edit
https://techcrunch.com/2020/10/21/gen-z-spends-10-more-time-in-non-game-apps-than-older-users/
https://www.statista.com/statistics/1020996/distribution-of-free-and-paid-ios-apps/
https://www.statista.com/statistics/266211/distribution-of-free-and-paid-android-apps/
https://www.pocketgamer.biz/news/77253/newzoo-global-mobile-gaming-market-116-billion-by-2024/
https://www.statista.com/statistics/271644/worldwide-free-and-paid-mobile-app-store-downloads/
https://www.statista.com/statistics/1058715/china-mobile-applications-available-app-stores/
https://www.statista.com/statistics/1239630/china-mobile-app-usage-key-figures/
https://www.statista.com/statistics/1058612/china-android-app-store-market-share/
https://www.statista.com/statistics/1058743/china-mobile-app-category-share/
FAQs
Convert your website into a mobile app