Average Customer Acquisition Cost for Ecommerce (2026 Benchmarks)

The average ecommerce CAC sits between $68 and $84, but that number has climbed roughly 40% in just the last two years. Industry, channel, and business model all shift the number significantly. The most effective counter isn't spending less on acquisition; it's getting more value from each customer you've already acquired.
The average ecommerce CAC sits between $68 and $84, but that number has climbed roughly 40% in just the last two years. Industry, channel, and business model all shift the number significantly. The most effective counter isn't spending less on acquisition; it's getting more value from each customer you've already acquired.
Ecommerce customer acquisition costs have been rising steadily for years, and 2025-2026 data confirms the trend isn't slowing down.
Between iOS privacy changes, ad auction inflation from mega-retailers like Temu, and Google Ads CPCs climbing 12.88% year-over-year, every dollar spent acquiring a customer buys less than it did a year ago.
This article breaks down what ecommerce brands are actually paying to acquire customers in 2026, across industries, channels, and business models, and what the data says about where those numbers are headed.
Like this kind of thinking? You'll like the Retention Edge. Every week, we break down what separates DTC brands that grow from the ones that just spend more. Free, practical, no BS. Check it out →
What Is Customer Acquisition Cost (CAC)?
Customer acquisition cost measures the average amount your business spends to convert someone into a paying customer. It includes everything that goes into getting that sale: ad spend, marketing team salaries, agency fees, creative production, software tools, and sales costs.
The formula:
Total sales & marketing spend / Number of new customers acquired = CAC
For example, if you spend $15,000 on marketing in a month and acquire 200 new customers, your CAC is $75.
CAC on its own doesn't tell you much. A $75 CAC is excellent if your average customer spends $400 over their lifetime. It's terrible if they buy once for $50 and never come back. The benchmarks below give you a starting point, but the real question is always how your CAC relates to what each customer is worth.
Average Ecommerce CAC: The Overall Benchmark
No one has complete data on average ecom acquisition costs - that's why we gathered data from a range of sources.
Most sources converge on a similar range for ecommerce retail:
The practical takeaway: if your ecommerce CAC falls between $50 and $90, you're within the normal range for most verticals.
Anything above $130 warrants a closer look at your channel mix and conversion funnel, unless you're selling high-ticket items where the unit economics still work.
CAC by Industry
Vertical matters more than most brands realize. A beauty brand and an electronics retailer operate in completely different cost environments, even if they're running ads on the same platforms.
Sources: First Page Sage (2025, 80+ clients), Upcounting (2025). Where both sources report data for the same vertical, ranges reflect both.
A few things stand out.
- Food and beverage brands consistently have the lowest CAC across sources, likely because the purchase decision is low-risk and repeat purchases happen naturally.
- Luxury goods have the highest CAC but also the highest LTV:CAC ratio (5.2:1), which means the unit economics still work despite spending $175 or more per customer.
- Fashion and electronics sit in a tighter spot, with above-average acquisition costs and below-average LTV ratios.
Learn more about LTV:CAC ratio and why it’s one of the most important metrics you can track.
CAC by Marketing Channel
Where you spend your budget changes your CAC dramatically. The gap between the cheapest and most expensive channels can be 10x or more.
Sources: First Page Sage (2025), Phoenix Strategy Group (2025)
To put these numbers in some context:: The SEO and email figures look high because they include all the upfront investment (content production, list building, tooling) divided across customers acquired.
Over time, both channels compound: the content you create and the list you build keep generating customers at near-zero marginal cost.
Paid search and paid social, by contrast, stop producing the moment you stop spending.
Referral programs consistently deliver the lowest CAC. Referred customers also have 16% higher lifetime value and are 4x more likely to refer others, creating a compounding effect.
Influencer and Affiliate Marketing
Influencer-generated content delivers roughly 30% lower cost per acquisition than brand-produced content, according to Impact.com's 2026 data.
Micro-influencers cost 60-70% less than macro-influencers while producing higher engagement rates, making them particularly interesting for brands watching their CAC closely.
US affiliate marketing spending crossed $10 billion for the first time in 2024, reflecting how seriously brands are investing in performance-based acquisition channels.
CAC by Business Model
How you sell matters as much as what you sell.
DTC brands face a particularly challenging environment right now. 69% are increasing their marketing spend in 2025, but 88% of subscription-based brands report higher acquisition costs compared to last year.
The DTC share of total retail ecommerce has plateaued around 19%, suggesting the easy growth phase is over.
The marketplace advantage is real but comes with tradeoffs.
Amazon sellers benefit from built-in traffic that cuts CAC roughly in half, but they give up margin, customer data, and brand control.
Wholesale is the cheapest acquisition channel of all, but the same limitations apply.
For brands that want to own their customer relationships and build long-term value, DTC remains the right model. It just requires a sharper approach to both acquisition and retention.
CAC by Company Size
Geography also plays a role. Southeast Asian markets see CAC 40-60% lower than the US, while Australia runs 20-35% higher.
Even within the US, West Coast brands tend to pay 15-25% more than the national average, likely reflecting higher competition density in those markets.
How Ecommerce CAC Has Changed Over Time
This is where the data gets uncomfortable. CAC isn't just high, it's been climbing faster than most brands' margins can absorb.
That SimplicityDX stat is worth sitting with. Ecommerce brands now lose an average of $29 on every new customer they acquire, after accounting for marketing costs and returns.
The only way to make up that loss is through repeat purchases, where profits average $39 per transaction.
In other words: the first sale is a loss leader. If your customers don't come back, you're paying to lose money.
Ad Platform Cost Trends
The major ad platforms tell a consistent story of rising costs.
Meta (Facebook/Instagram)
Meta's Q1 CPM hit an all-time high of $10.88 in 2025, up 19.2% year-over-year, based on benchmarking data from Varos (6,000+ companies, $4B in annual ad spend).
During Q4 2025, CPMs averaged $22.98, with November peaking at $25.22 during Black Friday/Cyber Monday.
The lead generation picture is similarly inflated. The average cost per lead on Meta rose to $27.66 in 2025, up 20.94% from $22.87 the year before, while conversion rates dropped from 8.67% to 7.72%.
Google Ads
87% of industries saw CPC increases in 2025, with an overall average CPC of $5.26, up 12.88% year-over-year.
Shopping ads specifically jumped 33.72% to $3.49, and beauty/personal care saw the steepest climb at +60.11%.
TikTok
TikTok remains the most affordable major ad platform with an average CPM of $4.26, roughly 49-53% cheaper than Meta during peak holiday periods.
CPCs range from $0.20 to $2.00, with optimized in-feed and Spark ads landing around $0.40-$0.70.
The trade-off is typically lower purchase intent: TikTok's ecommerce conversion rates range 0.5-5%.
What's Driving CAC Up?
Four structural forces are pushing acquisition costs higher. These aren't temporary blips; they're shifts in the landscape.
1. iOS App Tracking Transparency
Apple's ATT update in April 2021 was the single biggest shock to ecommerce advertising economics. 96% of US iPhone users opted out of tracking in the first month. The effects cascaded quickly:
- Ecommerce CAC increased 42% in the wake of ATT
- Meta estimated $10 billion in annual revenue lost from the change
- Facebook Pixel signal loss ranged from 12.5% to 37%, making attribution far less accurate
- Small, Meta-dependent ecommerce firms took the largest hit to revenue
The global ATT opt-in rate has settled at around 13.85% as of Q2 2024. This isn't getting better.
Brands that relied heavily on Meta's pixel-based targeting in the pre-ATT era have had to fundamentally rethink their acquisition strategies.
2. Temu and Shein Flooding Ad Auctions
Between them, Temu and Shein spent an estimated $2.7 billion on digital advertising in 2023 alone, with Temu reportedly funneling $1.2 billion into Meta.
As Etsy's CEO put it, these companies were "almost single-handedly impacting ad costs" across the industry.
3. Google Ads Inflation
Google's ad costs have been rising steadily, with CPCs up 12.88% year-over-year in 2025 and 87% of industries seeing increases.
Shopping ads, the bread and butter for many ecommerce brands, saw a 33.72% CPC jump to $3.49.
Meanwhile, overall ROAS declined 10.03% in 2025, meaning you're paying more and getting less back.
4. The Privacy Landscape
Google ultimately reversed its plan to phase out third-party cookies in April 2025, keeping them enabled by default.
But the damage was already done in terms of market direction: roughly 90% of marketers have shifted toward first-party and zero-party data strategies.
Even under Google's alternative Privacy Sandbox, early testing showed ~30% lower publisher revenue per impression compared to traditional cookie-based targeting.
The overall direction is clear: targeting will continue getting less precise and more expensive, regardless of what happens with cookies specifically.
What Makes a "Good" CAC?
Raw CAC numbers are meaningless without context. The metrics that matter are how your CAC relates to what each customer is worth, and how quickly you earn that investment back.
The LTV:CAC Ratio
The universally cited benchmark is 3:1, meaning you earn $3 in customer lifetime value for every $1 you spend on acquisition. Here's how to think about different ratios:
That last point surprises people. A 10:1 ratio sounds great, but it often means you're not investing enough in growth and a competitor who's willing to spend more aggressively will eventually take your market share.
LTV:CAC by Vertical
Not every industry can hit the same ratios. Here's how current benchmarks break down:
Source: Upcounting (2025)
Luxury and food brands have the best ratios for different reasons: luxury because of high order values, and food because of high purchase frequency.
Electronics brands sit at just 2.1:1, which means they need either higher-margin products, better retention programs, or both to build a sustainable business.
CAC Payback Period
How quickly you recover your acquisition cost matters as much as the ratio. Current benchmarks from Qubit Capital:
- Typical ecommerce payback: 3-6 months
- Elite operators: 5-7 months (at scale with healthy margins)
- Maximum healthy target: 12 months
If it takes longer than 12 months to earn back what you spent acquiring a customer, your cash flow will struggle to support growth, even if the lifetime unit economics eventually work.
How to Reduce Your CAC
There are a number of ways to get your CAC down.
- Improve your conversion rate. If you're spending $10,000/month on ads and converting at 2%, moving to 3% cuts your effective CAC by a third, without spending an extra dollar. Audit your product pages, checkout flow, and mobile experience.
- Shift budget toward lower-CAC channels. Referral programs ($40-$65 CAC) and email marketing to existing audiences are dramatically cheaper than paid social or search.
- Narrow your targeting. Broad audiences feel like they cast a wider net, but they also mean your ads reach people who are unlikely to buy. Tighter targeting around your highest-value customer segments typically reduces waste and lowers CAC.
- Invest in SEO and content. Organic search has a high upfront cost but compounds over time. The content you publish today will still generate traffic and customers a year from now at near-zero marginal cost.
But focusing all your efforts on lowering acquisition costs is not always the best way.
Get More Value from Each Customer
There’s only so much you can do to reduce CAC.
The real boost for your acquisition economics: increasing the value of each customer.
This is where the math gets interesting. If your average customer buys once and never comes back, even a low CAC might not save you. But if you can turn one-time buyers into repeat customers, the economics shift in your favor quickly.
Consider: it's 5-25x more expensive to acquire a new customer than to retain an existing one. A 5% improvement in retention can drive 25-95% more profit.
The probability of selling to an existing customer is 60-70%, compared to just 5-20% for a new prospect.
This is why the smartest ecommerce brands are shifting their focus from acquisition to retention. Not abandoning acquisition, just recognizing that the fastest path to profitability runs through the customers they've already paid to acquire.
Why a Mobile App Changes the CAC Equation
When acquisition costs keep rising and you can't meaningfully control the forces driving them up (privacy changes, ad inflation, competition), the highest-leverage move is getting more lifetime value from each customer. A mobile app is one of the most effective ways to do that.
Here's why.
Push notifications are a free, owned marketing channel
Every time you want to reach a customer through paid ads or even email, there's a cost. Push notifications go directly to their phone's lock screen at essentially zero marginal cost. They're also harder to ignore than an email sitting in a promotions tab, which translates to higher engagement and more repeat purchases.
Apps drive higher order values and purchase frequency
Mobile app users consistently spend more per order and buy more often than mobile web visitors. That's partly because of the frictionless experience (saved payment, one-tap checkout) and partly because of the ongoing relationship a home screen icon creates. When your brand is on someone's phone, you're part of their daily environment.
Retention compounds against rising CAC
If your CAC is $75 and a customer buys once for $90, you've barely covered your acquisition cost. But if that same customer buys four times over the next year because they have your app on their phone and you're reaching them with relevant push notifications, that $75 CAC now returns $360 in revenue. You didn't lower your CAC; you made it matter less.
Launching Your Mobile App
MobiLoud is the most effective way for an ecommerce brand to launch a mobile app.
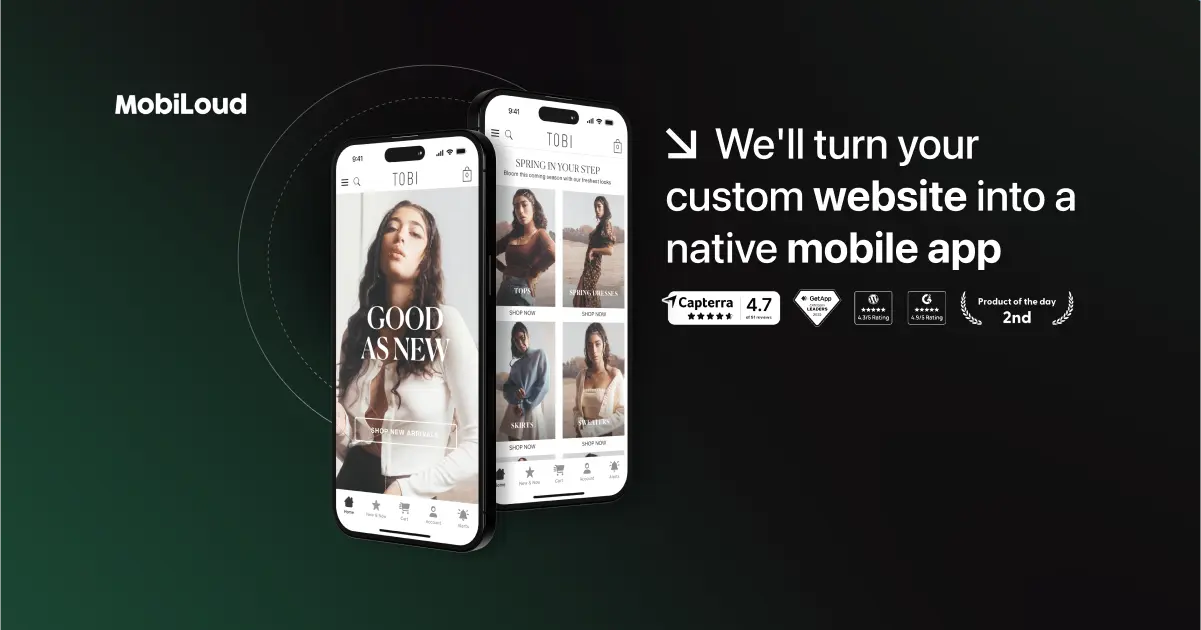
You’re not rebuilding anything, you’re not managing a new system, you’re not making a $100K gamble on a new channel.
You’re simply converting your existing website - the website that works, that you’ve spent countless hours and dollars perfecting - into a mobile app.
All your integrations work, all your features work, everything works as it does on the site, with the addition of native features that make your app feel like a real, professional, native mobile app.
If you want to see what your store looks like as a native mobile app, book a free strategy call. We’ll show you what’s possible, share some examples of other brands we’ve helped to launch their own mobile app, and help you understand if this is the right way forward for you.
FAQs
Convert your website into a mobile app