What Percentage of Internet Traffic Is Mobile? [2026 Update]

Mobile devices now account for nearly two-thirds of all internet traffic worldwide.
As of early 2026, mobile represents 62-64% of global web traffic, with desktop holding roughly 35% and tablets making up the remaining 2%.
This isn't a new trend; mobile surpassed desktop back in late 2016. But the gap continues to widen.
What's changed is how that traffic behaves: where it comes from, what users do with it, and what it means for businesses trying to reach them.
This guide breaks down the latest mobile traffic statistics by region, country, and use case, plus what these numbers mean for ecommerce brands in particular.
Deep dive: Mobile Apps vs Mobile Websites: Why >90% of mobile time is spent in apps
Global Mobile vs Desktop Traffic (2026)
Here's the latest breakdown on mobile vs desktop internet traffic:
For context, in 2013 desktop held 79% of traffic versus mobile's 16%. The reversal has been dramatic and shows no signs of slowing.
Key Milestones
- 2016: Mobile surpassed desktop for the first time
- 2018: Mobile reached 50.88% market share
- 2020: Mobile hit 55% during pandemic-driven usage spikes
- 2025: Mobile crossed 60% globally
- 2026: Mobile stabilizing at 62-64%
Mobile Traffic by Region
Not all regions use the internet the same way.
Mobile dominance varies significantly based on infrastructure, economics, and device preferences.
Let's take a look at the data:
Why the Regional Differences?
Africa and Asia lead in mobile traffic because many users skipped desktop computing entirely.
Mobile phones were their first, and often only, way to access the internet. Infrastructure investments went straight to cellular networks rather than traditional broadband.
North America and Europe show more balance because desktop computing was already established before smartphones arrived.
Work cultures in these regions also favor desktop usage for productivity tasks.
Mobile Traffic by Country
Individual countries show even more dramatic variation.
Highest Mobile Traffic Share
More Balanced Markets
Notable Observations
The US is an outlier among developed nations.
While most of the world has gone mobile-first, American internet usage remains nearly split between mobile and desktop.
Desktop still leads slightly, likely due to workplace usage patterns and larger home setups.
China's desktop dominance is surprising.
Despite being a mobile-first market in many ways (mobile payments, super-apps), web traffic statistics show desktop leading.
This may reflect how Chinese users spend more in-app time (which isn't always counted as "web" traffic) rather than browsing the open web on mobile.
Germany has the lowest mobile share among major developed economies at 42%, reflecting strong desktop work culture and privacy-conscious users who may prefer desktop browsing.
Mobile App vs Mobile Web
When users are on mobile, where do they spend their time?
Users spend nearly 90% of their mobile time in apps, not browsers. This has major implications for businesses:
- Discovery often happens on mobile web (Google searches, social media links)
- Engagement happens in apps (longer sessions, repeat visits)
- Conversion is significantly higher in apps
In-App Browsers
About 31% of mobile web sessions now happen through in-app browsers; when users click links within Instagram, Facebook, LinkedIn, or other apps.
These sessions use lightweight embedded browser views rather than Safari or Chrome directly.
Mobile Browser Market Share
When users do browse the mobile web, Chrome dominates.
Chrome's dominance comes from being the default browser on Android devices (which hold ~70% of global smartphone market share).
Safari's share comes entirely from iOS users, where it's the default.
Mobile Internet Speeds
Mobile connections are getting faster, narrowing the gap with fixed broadband.
Global Average
- Average global mobile download speed: 50-60 Mbps (2025)
- Average global broadband speed: 97.3 Mbps (up 12.1% year-over-year)
Fastest Mobile Internet by Country
5G Adoption
5G is accelerating mobile speeds globally:
- 2.8-2.9 billion 5G subscriptions worldwide (end of 2025)
- 55% of the world's population now has 5G network access
- 5G is expanding 4x faster than 4G LTE did in its comparable period
- By 2027, 5G is expected to overtake 4G as the dominant mobile technology
Regional 5G Penetration (2025):
- North America: 79%
- Northeast Asia: 61%
- Western Europe: 55%
- China: 1 billion+ 5G connections
Mobile Ecommerce: Traffic vs Conversion
Here's where the data gets interesting for ecommerce brands.
The Traffic-Conversion Gap
Mobile drives the majority of traffic but converts at roughly half the rate of desktop. This gap represents both a challenge and an opportunity.
Why Mobile Converts Lower
There are a few reasons why most ecommerce sites find lower conversion rates on mobile vs desktop:
- Screen size: Harder to browse products, compare options, read reviews
- Form entry friction: Checkout forms are painful on small screens
- Trust perception: Users feel less secure making purchases on mobile
- Research vs buy: Many users research on mobile, then purchase on desktop
There's one solution to this, however; a mobile channel that converts at an even higher rate than desktop, in many cases.
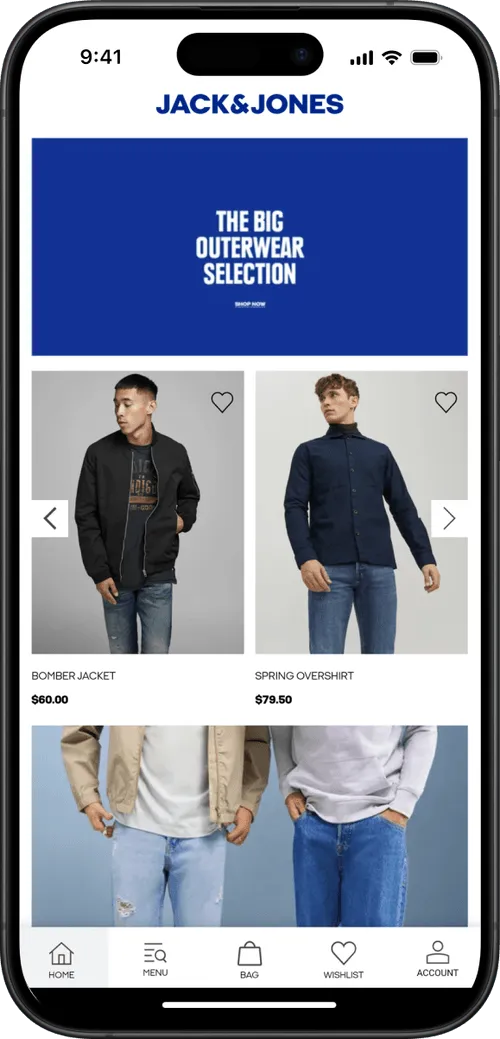
How Apps Change the Equation
Native mobile apps close the conversion gap significantly:
- Apps convert at 157% higher rates than mobile web
- 85% of US mobile shoppers prefer apps over mobile websites
- Push notifications drive 3-10x higher engagement than email
- Saved payment methods reduce checkout friction
This is why major retailers invest heavily in their mobile apps. They've found a way to capture mobile traffic while maintaining desktop-level (or better) conversion rates.
Learn more: Best Ecommerce Platforms by Market Share
MobiLoud and Mobile Traffic
For ecommerce brands looking to capture mobile traffic more effectively, a native mobile app can transform how customers engage with your store.
MobiLoud helps brands extend their existing website into native iOS and Android apps, without rebuilding their entire tech stack. Your website powers the app, and we add native app capabilities on top, which effectively turns your web store into a full-featured mobile app.
It's the best way to build a mobile app, if you don't want the cost and hassle of multiple codebases and expensive mobile development teams.
Want to see what's possible?
Get a free preview of your app →
Data Sources
This article synthesizes data from Statista, StatCounter, DataReportal, Ericsson Mobility Report, and regional market research. Figures represent late 2025/early 2026 data where available.
FAQs
Convert your website into a mobile app


.avif)