Ecommerce app revenue calculator
Get an estimate of what your new channel could add to your bottom line, based on the typical lift we see from brands like yours.
Typical app results for fashion and apparel stores, applied to your numbers.
3% of your visitors use your app
$15,900
/month through your app
$191,000/year
~9% total online revenue
4.5% of your visitors use your app
$41,900
/month through your app
$503,000/year
~24% total online revenue
Enter your numbers to see your estimate.
Our mobile app revenue calculator works in two steps, in order to get a rough estimate of what your app could bring in.
First it works out how many of your customers are likely to use your app. Then, it looks at the typical increase in key metrics from app users, to work out how much these customers are likely to contribute over the baseline.
Both parts tend to look a little different across different industries - Food & Beverage shoppers, for example, are likely to return and shop more often than buyers in Electronics or Home & Kitchen.
Your app users are your monthly visits times the share of visitors who use your app. That’s about 2% to 6% of visitors, depending on your industry and type of brand.
Typical metric lifts come from industry estimates, including our Ecommerce Mobile App Benchmark Report. App shoppers convert 1.7 to 3 times better than shoppers on mobile web, spend 10% to 50% more per order and shop 1.7 to 3 times as often.
We produced a conservative estimate as well as a stronger estimate, to give you an idea of the typical range we see across different brands. Here’s a summary of the figures we used:
| Industry | Visitors using the app | Visits a month | Conversion rate | Order value | App’s share of online revenue |
|---|---|---|---|---|---|
| Fashion & apparel | 3–4.5% | 2–2.5 | 1.4–1.8× | +10–20% | 9–24% |
| Beauty & cosmetics | 3–4.5% | 2–2.5 | 1.3–1.6× | +12–27% | 9–23% |
| Health & supplements | 3–5% | 2.2–2.8 | 1.4–1.6× | +6–15% | 10–26% |
| Food & beverage | 3–4.5% | 2.2–3 | 1.4–1.6× | +8–17% | 10–25% |
| Grocery | 4–6% | 2.5–3 | 1.3–1.4× | +6–15% | 14–29% |
| Pet supplies | 3–4.5% | 2–2.5 | 1.3–1.5× | +6–15% | 8–19% |
| Baby & kids | 3–4.5% | 2–2.5 | 1.3–1.6× | +10–23% | 9–22% |
| Home, kitchen & furniture | 2–3% | 1.5–2 | 1.3–1.6× | +8–17% | 4–11% |
| Jewelry & luxury | 2–3% | 1.6–2 | 1.4–1.9× | +12–25% | 5–14% |
| Sports & outdoors | 2–3% | 1.7–2.2 | 1.3–1.5× | +8–17% | 5–12% |
| Toys & games | 2.5–4% | 1.8–2.3 | 1.3–1.5× | +8–15% | 6–16% |
| Electronics | 1.5–2.5% | 1.5–2 | 1.3–1.6× | +10–23% | 3–10% |
| Other | 2.5–4% | 1.8–2.3 | 1.4–1.7× | +10–20% | 7–19% |
Not all of this is new revenue. Some of it would have come through your website anyway, from shoppers who’d have bought there instead. But app shoppers visit more often, convert better and spend more per order than they do on your website, and that lift is revenue you wouldn’t have had without the app. We look at how much of an app’s revenue is new in this breakdown.
MobiLoud helped these brands launch custom native apps, adding a new sustainable revenue stream with minimal investment and overhead.
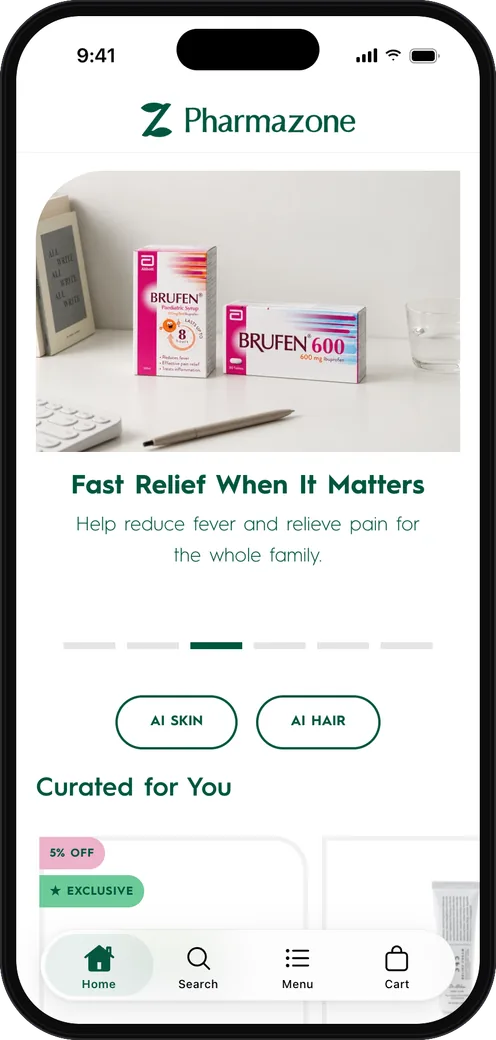
Pharmazone
Online pharmacy Shopify
63% of Online Revenue
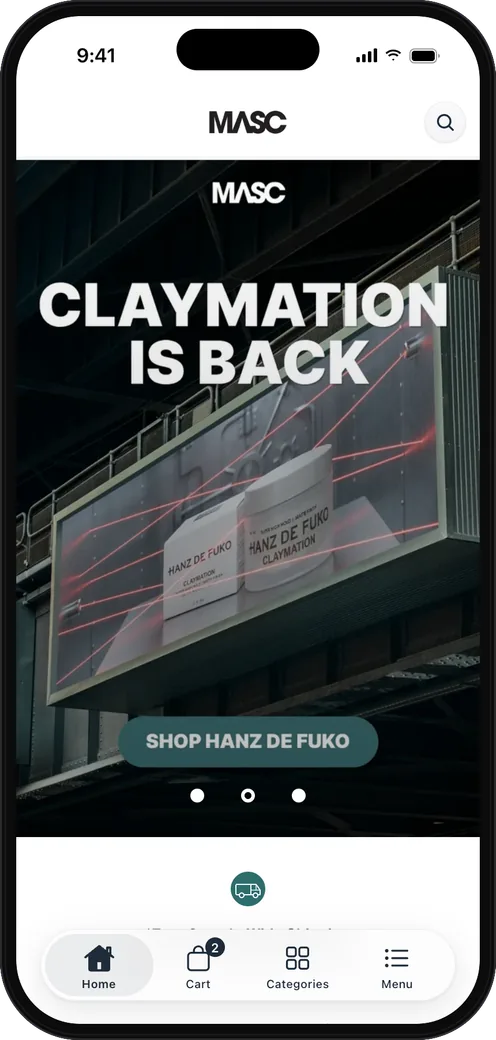
MASC
Men’s grooming Shopify
20% of Online Revenue
Have any more questions we didn't answer? Book a 30-minute call or send us a message to clear it all up.
Book a callThis estimate is a guide built from the results of live ecommerce apps, not a forecast for your store. What moves your own number most is how many of your customers download the app and how often you give them a reason to open it, with push notifications, app-only offers and new launches.
Stores whose customers buy often, like grocery, supplement and beauty brands, get the most from an app: more of their shoppers download it, and they come back to it again and again. Where people buy less often, like electronics or furniture, fewer shoppers use an app, but they tend to place bigger orders in it. The figures for each industry follow those patterns.
Not all of the revenue through your app is new, since some of those shoppers would have bought on your website anyway. But app shoppers visit more often, convert better and spend more per order than they do on your website, and that lift is new revenue your website alone wouldn’t bring in.
How app shoppers behave comes from our Ecommerce Mobile App Benchmark Report, which combines results from live MobiLoud apps with industry research, adjusted for each industry. The calculator compares app shoppers with your whole website, desktop included, so its figures are lower than the report’s comparison with mobile web. They’re estimates, not measurements of your store, and you can change any of them under “Adjust the assumptions”.
Most brands grow their app audience from shoppers they already have. The most common ways are a smart banner on the mobile site and an app-only discount, often 10% off the first order in the app. The more of your shoppers use the app, the more revenue it brings in.
MobiLoud typically launches an app in 2 to 4 weeks, including design, build and app store submission.
See how your store would look and feel as a mobile app, before deciding whether to build.
No credit card required.