The Latest Black Friday Statistics: $41.1 Billion Online Sales


The latest Black Friday statistics shine a light on how the days following Thanksgiving have grown to become the most important period of the year for retailers.
We’ve almost come to think of Thanksgiving as the day before Black Friday, rather than the other way around.
Though Black Friday is nothing new - it’s been a thing since the 1970s, and possibly even earlier - the way we shop on Black Friday and subsequent days is evolving every year, from more people taking advantage of Black Friday-Cyber Monday sales, to a higher share of sales online and on mobile devices.
If you’re interested in what the data shows about how we shop during the biggest shopping event of the year, read on for the latest statistics.
Want to learn how to drive low-cost sales and better retention this Black Friday? Get the 2025 BFCM Mobile App Playbook to learn why apps are a competitive advantage, and how to ace Cyber Week with mobile apps & push notifications.
2024 Black Friday Shopping Statistics
According to the data, Black Friday (and the surrounding days, including Thanksgiving, Cyber Monday, and the newly coined “Small Business Saturday”) is bigger than ever.
Check out the following statistics from the most recent Black Friday/Cyber Week to get an idea of just how massive this period is for retailers, as well as getting an idea of what consumers’ shopping habits look like at the unofficial start of the holiday shopping season.
More than 1 in 2 Americans shop online or in-person during Cyber Week
In 2024, 197 million Americans made a purchase during Cyber Week, either online or in person.
That’s approximately 59% of the entire US population.
This figure is down slightly from 2023, where a record 200.4 million Americans participated in Cyber Week.

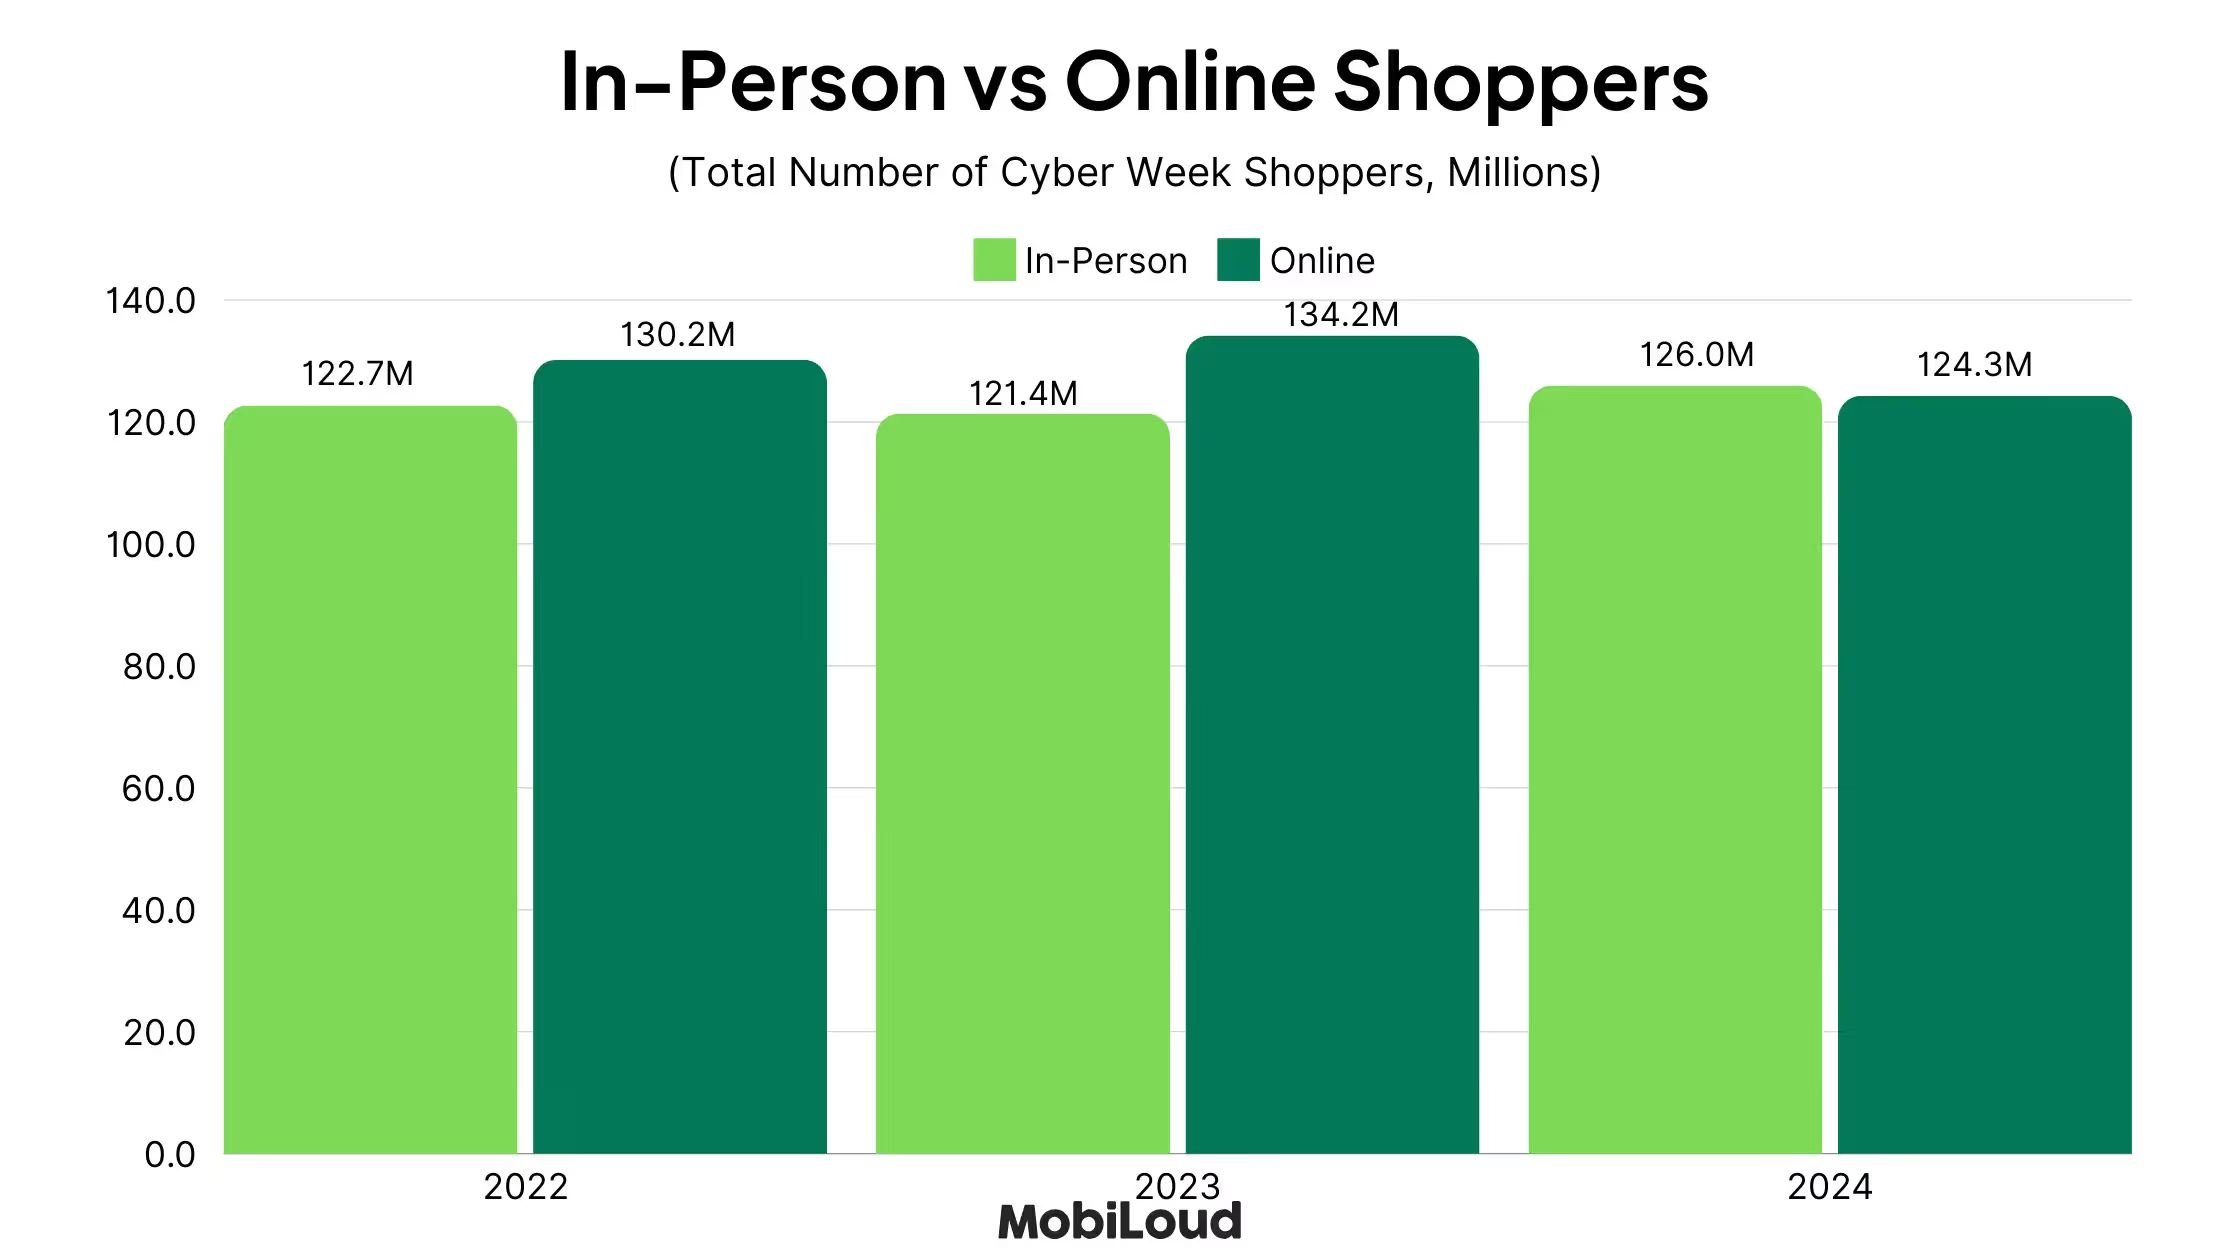
In-Store Shopping Up, Online Down
In a slight reversal of trends, 2024 saw more people shopping in person, and fewer online.
126 million people made a purchase in-store during Cyber Week, up from 121.4 million in 2023.
124.3 million Americans made a purchase online, down from 126 million in 2023.
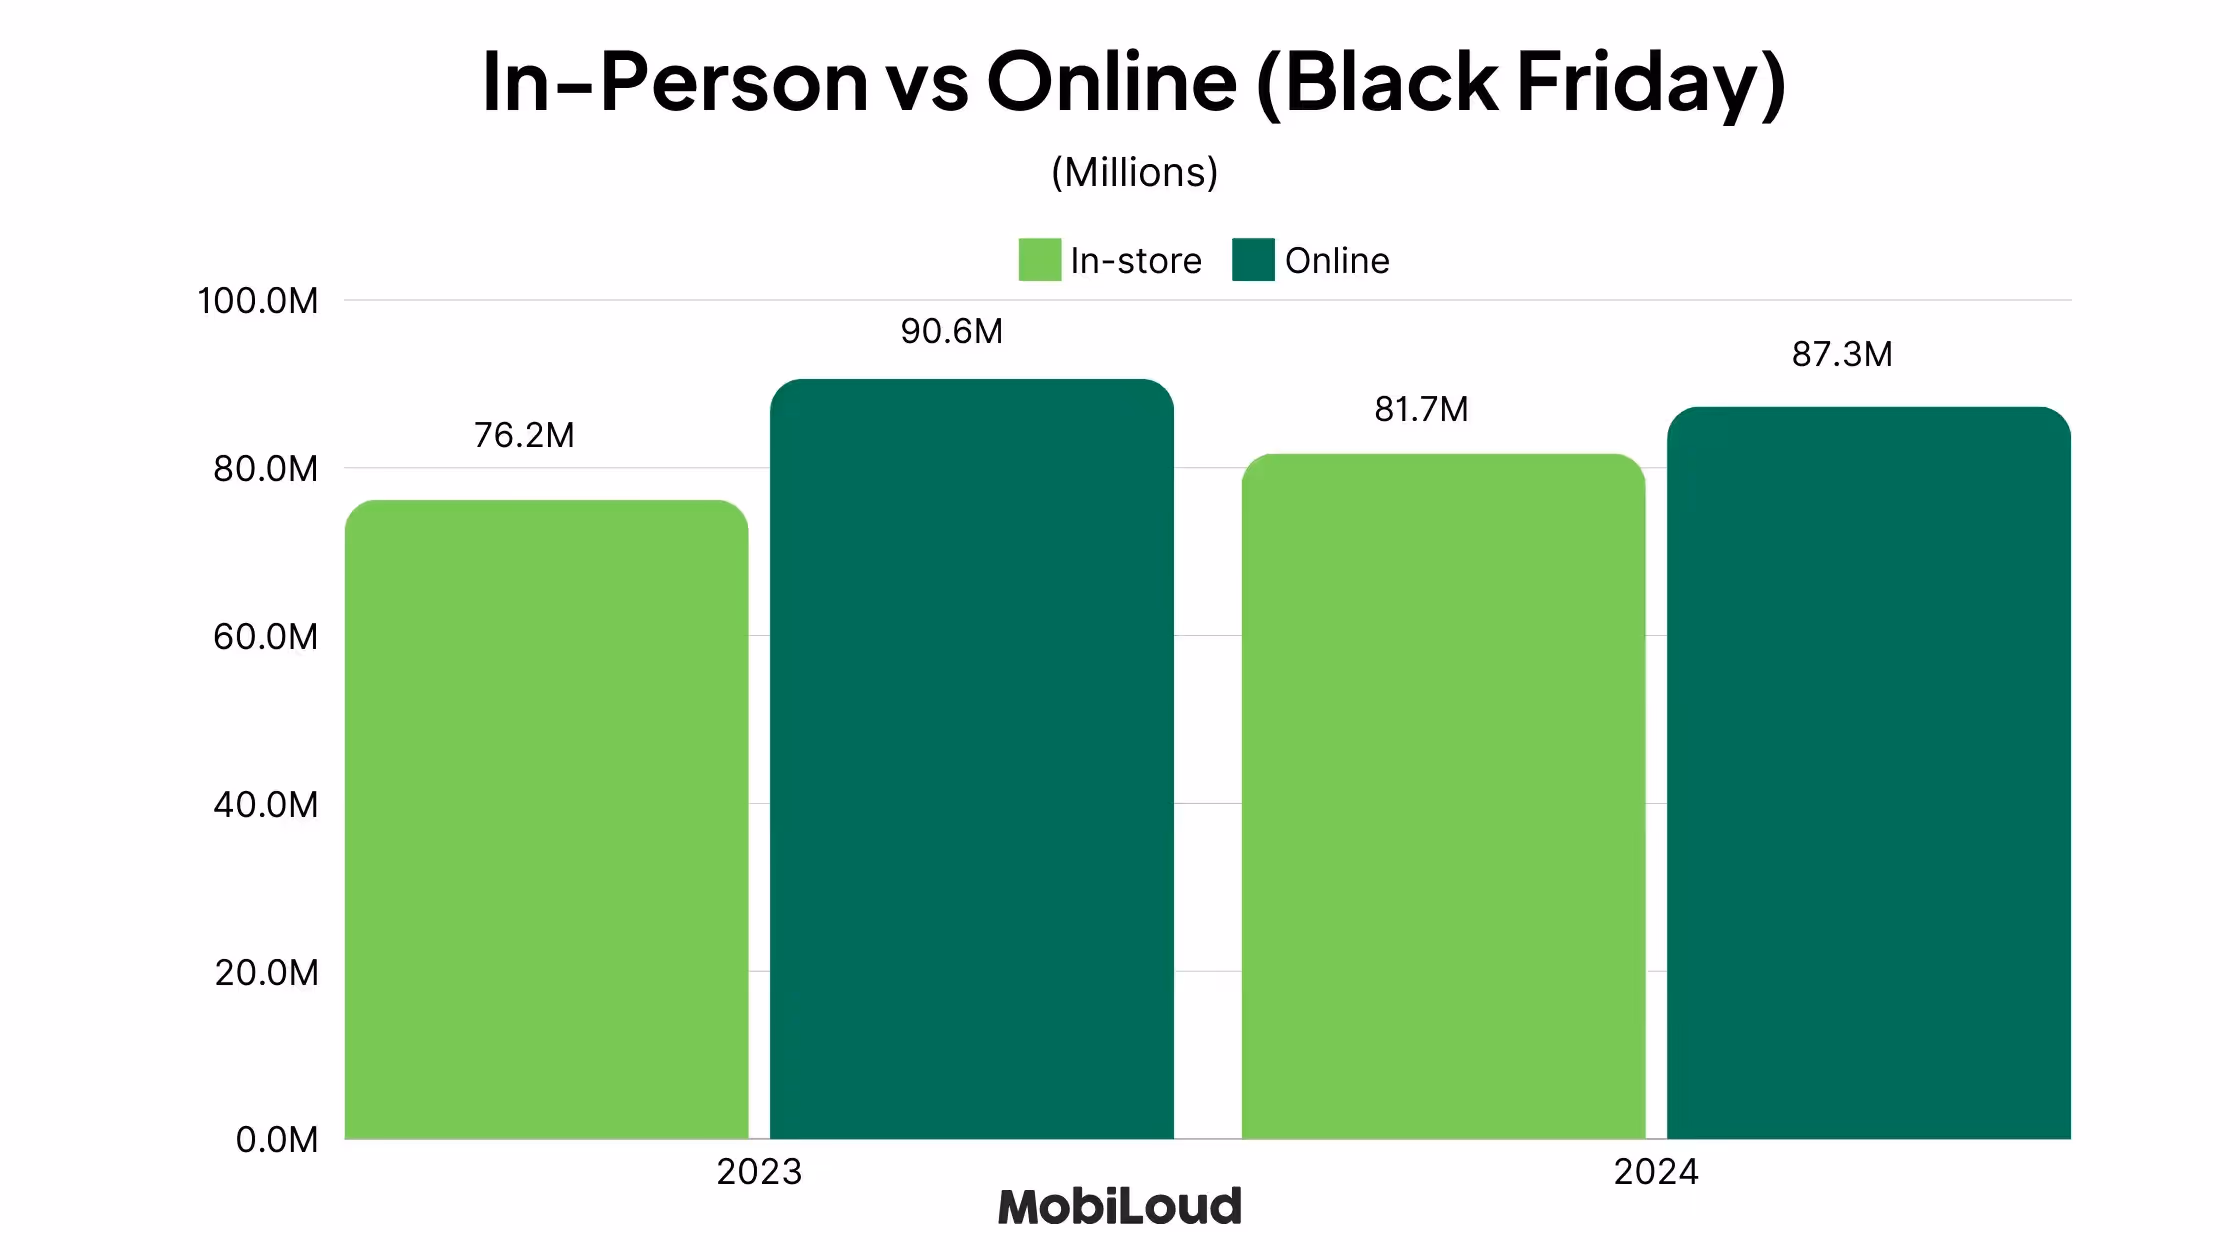
Online Shopping Wins on Black Friday
The distribution flips for Black Friday - 87.3 million Americans made a purchase online, compared to 81.7 million in-person.
The figures are closer than the previous year, however, where we saw 76.2 million consumers shop in-store compared to 90.6 million online.
64 Million People Shopped Online on Cyber Monday
64.4 million people made a purchase online on Cyber Monday 2024, making it the second biggest day for ecommerce.
This number was down from 2023, which saw 73.1 million online shoppers on Cyber Monday.
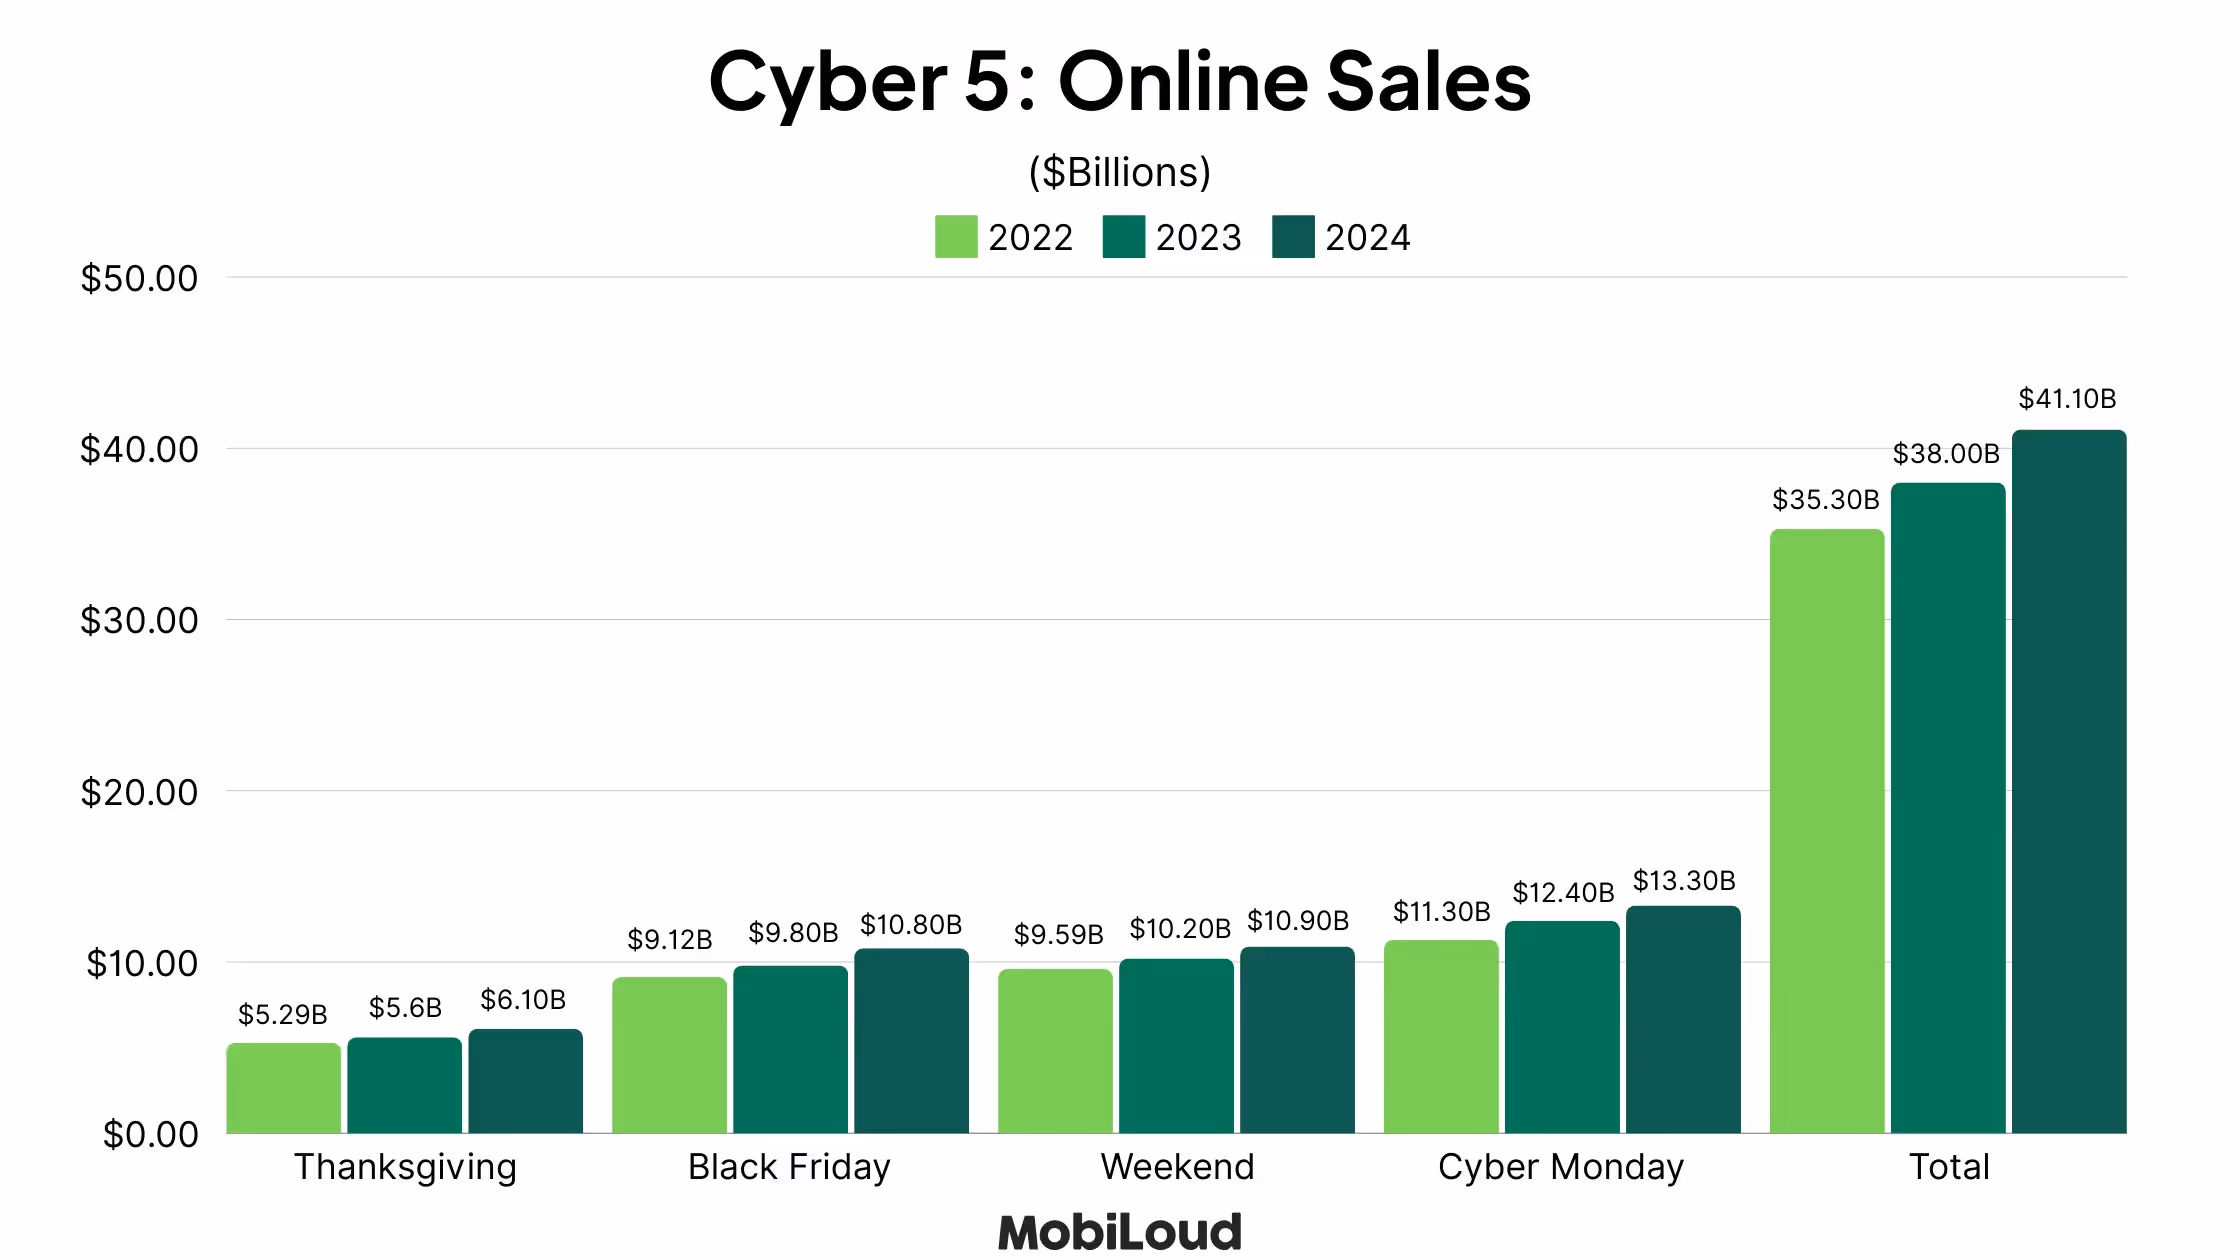
A Record $41.1 Billion Was Spent Online During Cyber Week
Despite a decrease in overall shoppers, online sales for the “Cyber 5” period were up, setting a new record for Cyber Week sales in the US.
Shoppers spent $41.1 billion total across the period from Thanksgiving to Cyber Monday - up from $38 billion in 2023.
New Online Sales Records for Black Friday and Cyber Monday
Yet again, the two biggest days of the Cyber 5 set new records for online sales.
US shoppers spent $10.8 billion online on Black Friday, up from $9.8 billion in 2023.
Cyber Monday online sales totaled $13.3 billion, up from $12.4 billion a year ago.
Sales on Thanksgiving itself, as well as the Saturday-Sunday period, also set new records.
Global Cyber Week Online Sales Top $300 Billion
Worldwide, online shoppers spent $314.9 billion during Cyber Week, according to a report from Salesforce, up 6% on the previous year.
Black Friday contributed $74.4 billion in online sales (increase of 5% YoY), while Cyber Monday contributed $49.7 billion (up 2% YoY).

Mobile Continues to Grow
Mobile commerce is not slowing down.
Mobile first beat out desktop in 2022, accounting for 51% of all online sales during Cyber Week.
The mobile shopping market share grew again in 2023, reaching 51.8% of all online sales.
And it continues to rise.
57% of all US online sales on Cyber Monday came on mobile devices - $7.6 billion in total, and a 13.3% increase YoY.
Worldwide, 70% of online spending came on mobile, up from 67% in 2023.
Mobile accounted for 57% of all online sales on Cyber Monday 2024, and 70% of all online spending worldwide during Cyber Week.
US holiday season sales expected to top $1 trillion
Experts predict a total of $1.353 billion in US retail sales over the holiday season for 2024, up slightly from the previous year.
19.7% of these sales happen online, meaning over $266 million in US ecommerce sales over the holiday period.

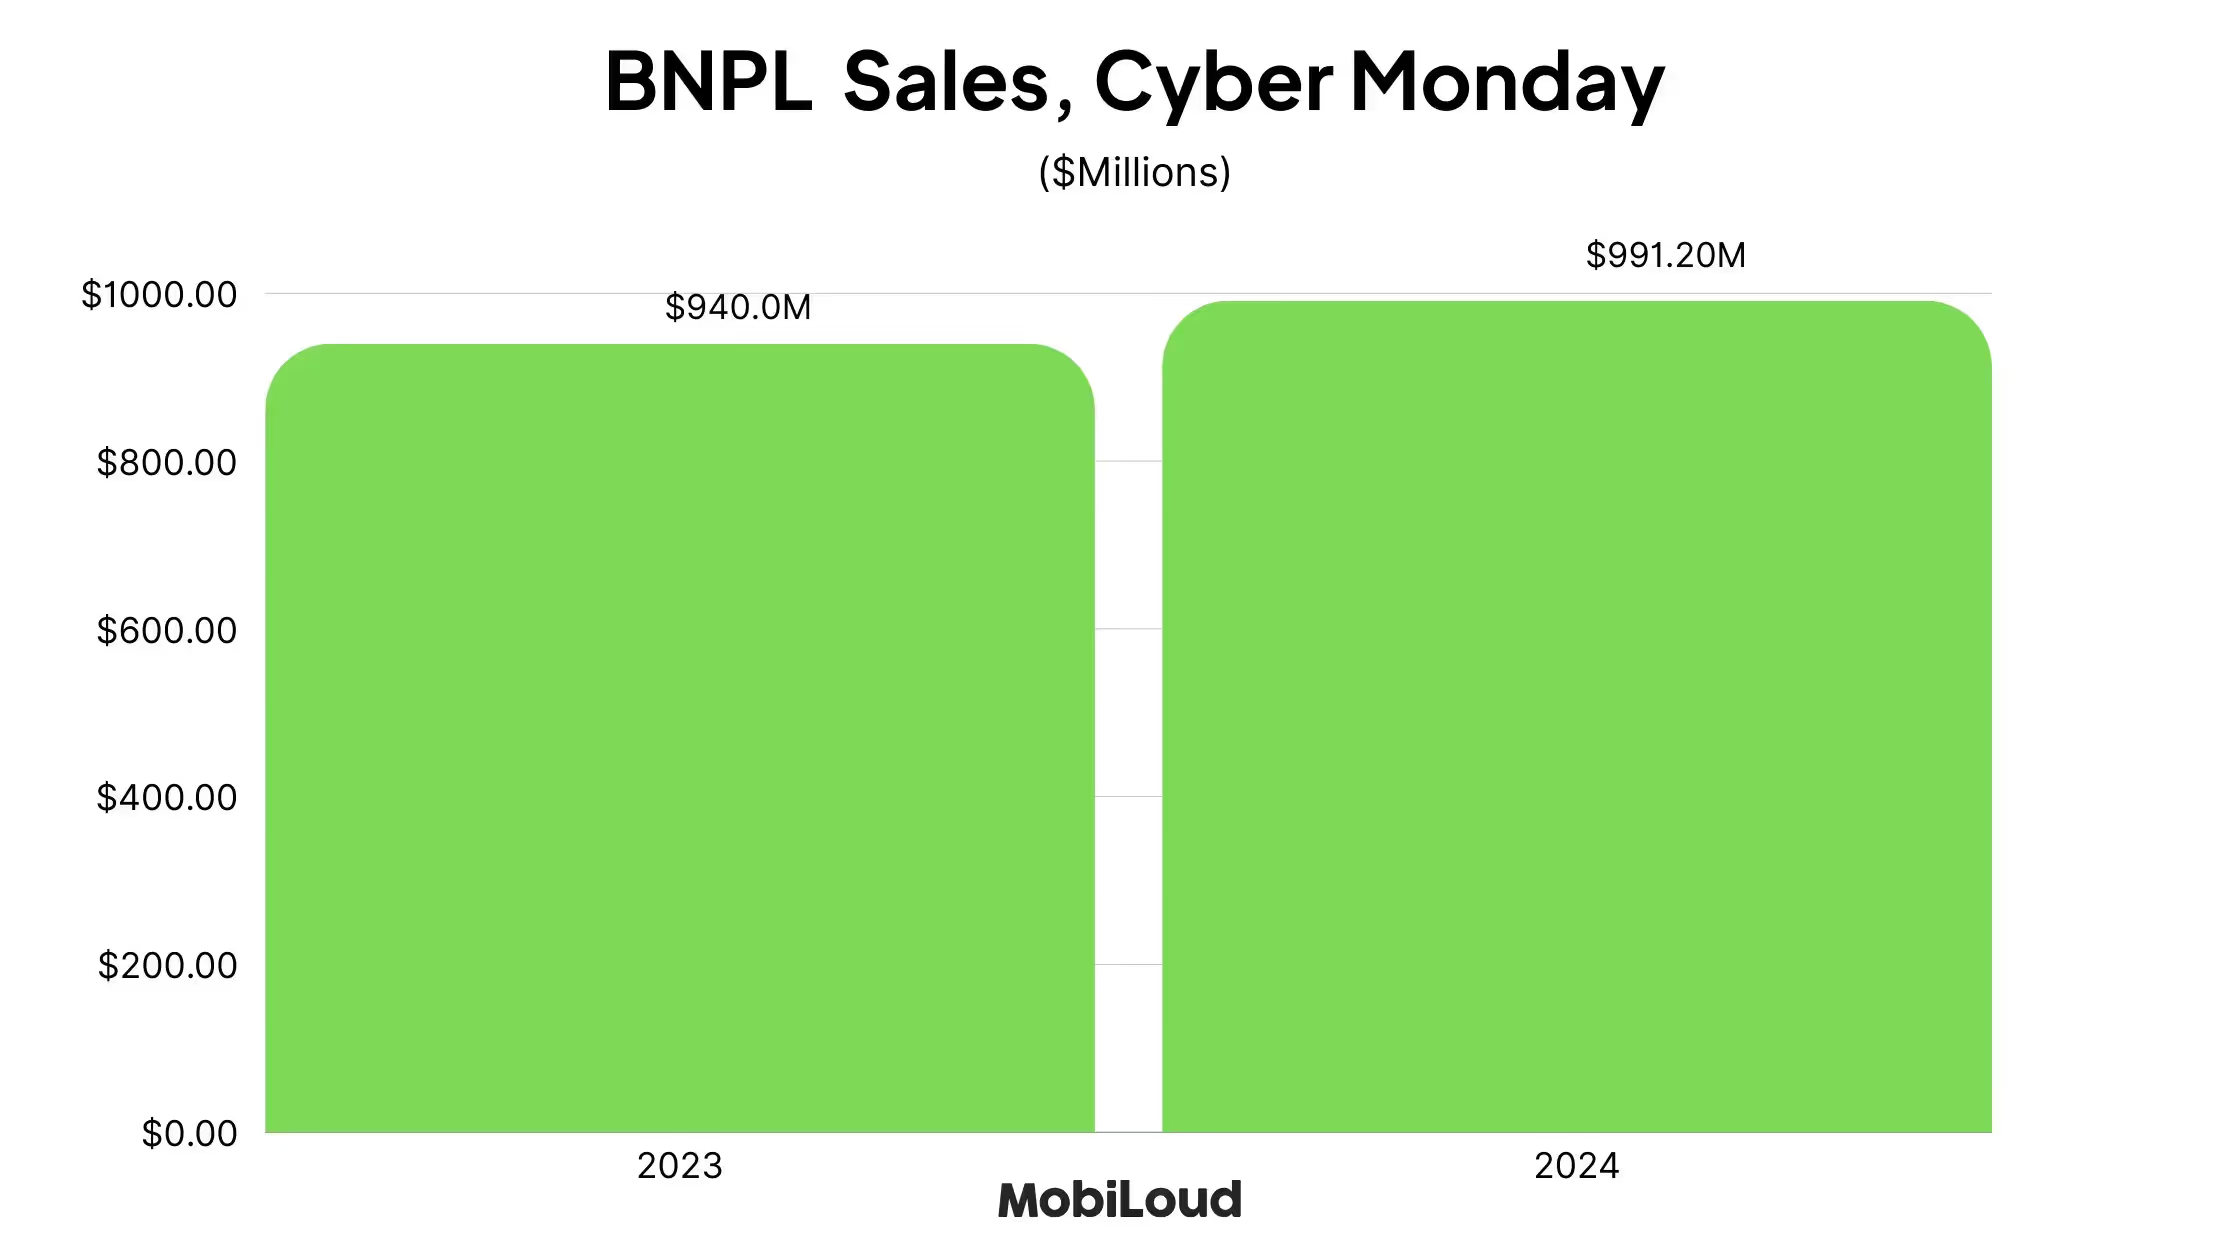
Nearly $1 Billion Spent with Buy Now Pay Later on Cyber Monday
Buy Now Pay Later (BNPL) services inch closer to driving $1 billion in sales on Cyber Monday alone.
In 2024, consumers spent $991.20 million - an increase of 5.5% on the previous year.
Of these sales, 75.2% came on mobile devices.
Consumers spent $15.7 million per minute during Cyber Monday peak
At the peak hour of 10pm-11pm EST on Cyber Monday, consumers spent a massive $15.7 million per minute.
AI having a major impact on Cyber Week shoppers
Analysis from Salesforce found AI to be a major player in online shopping during Cyber Week.
$60 billion worth of global online sales was influenced by AI in some way.
Retailers that used generative AI and AI agents 18% more during Cyber Week than the week before. Those who did use AI reportedly had 2% higher conversion rates than retailers not using AI.
Shoppers leaned heavily on AI to assist their purchasing journey too, using AI-powered customer service agents 38% more than the previous week.
Average order value for November 2023 was 2.7% higher than 2022
Consumers are spending more in each order than the previous year.
Between November 1 and November 27 2023, average order value was 2.7% higher than the same period the previous year.
The increase is even higher over Thanksgiving weekend, with a 3.2% increase in AOV for the period of 25-26 November.
82% of people shop during Cyber Week
More than four out of five people say they shop at some point during Cyber Week, whether it’s online, in-person, or both.
2.5x as many people shop online vs in-person
Of these people, the majority say they plan to shop online. 68% of people shop online during Cyber Week, while only 27% shop at a brick and mortar store.
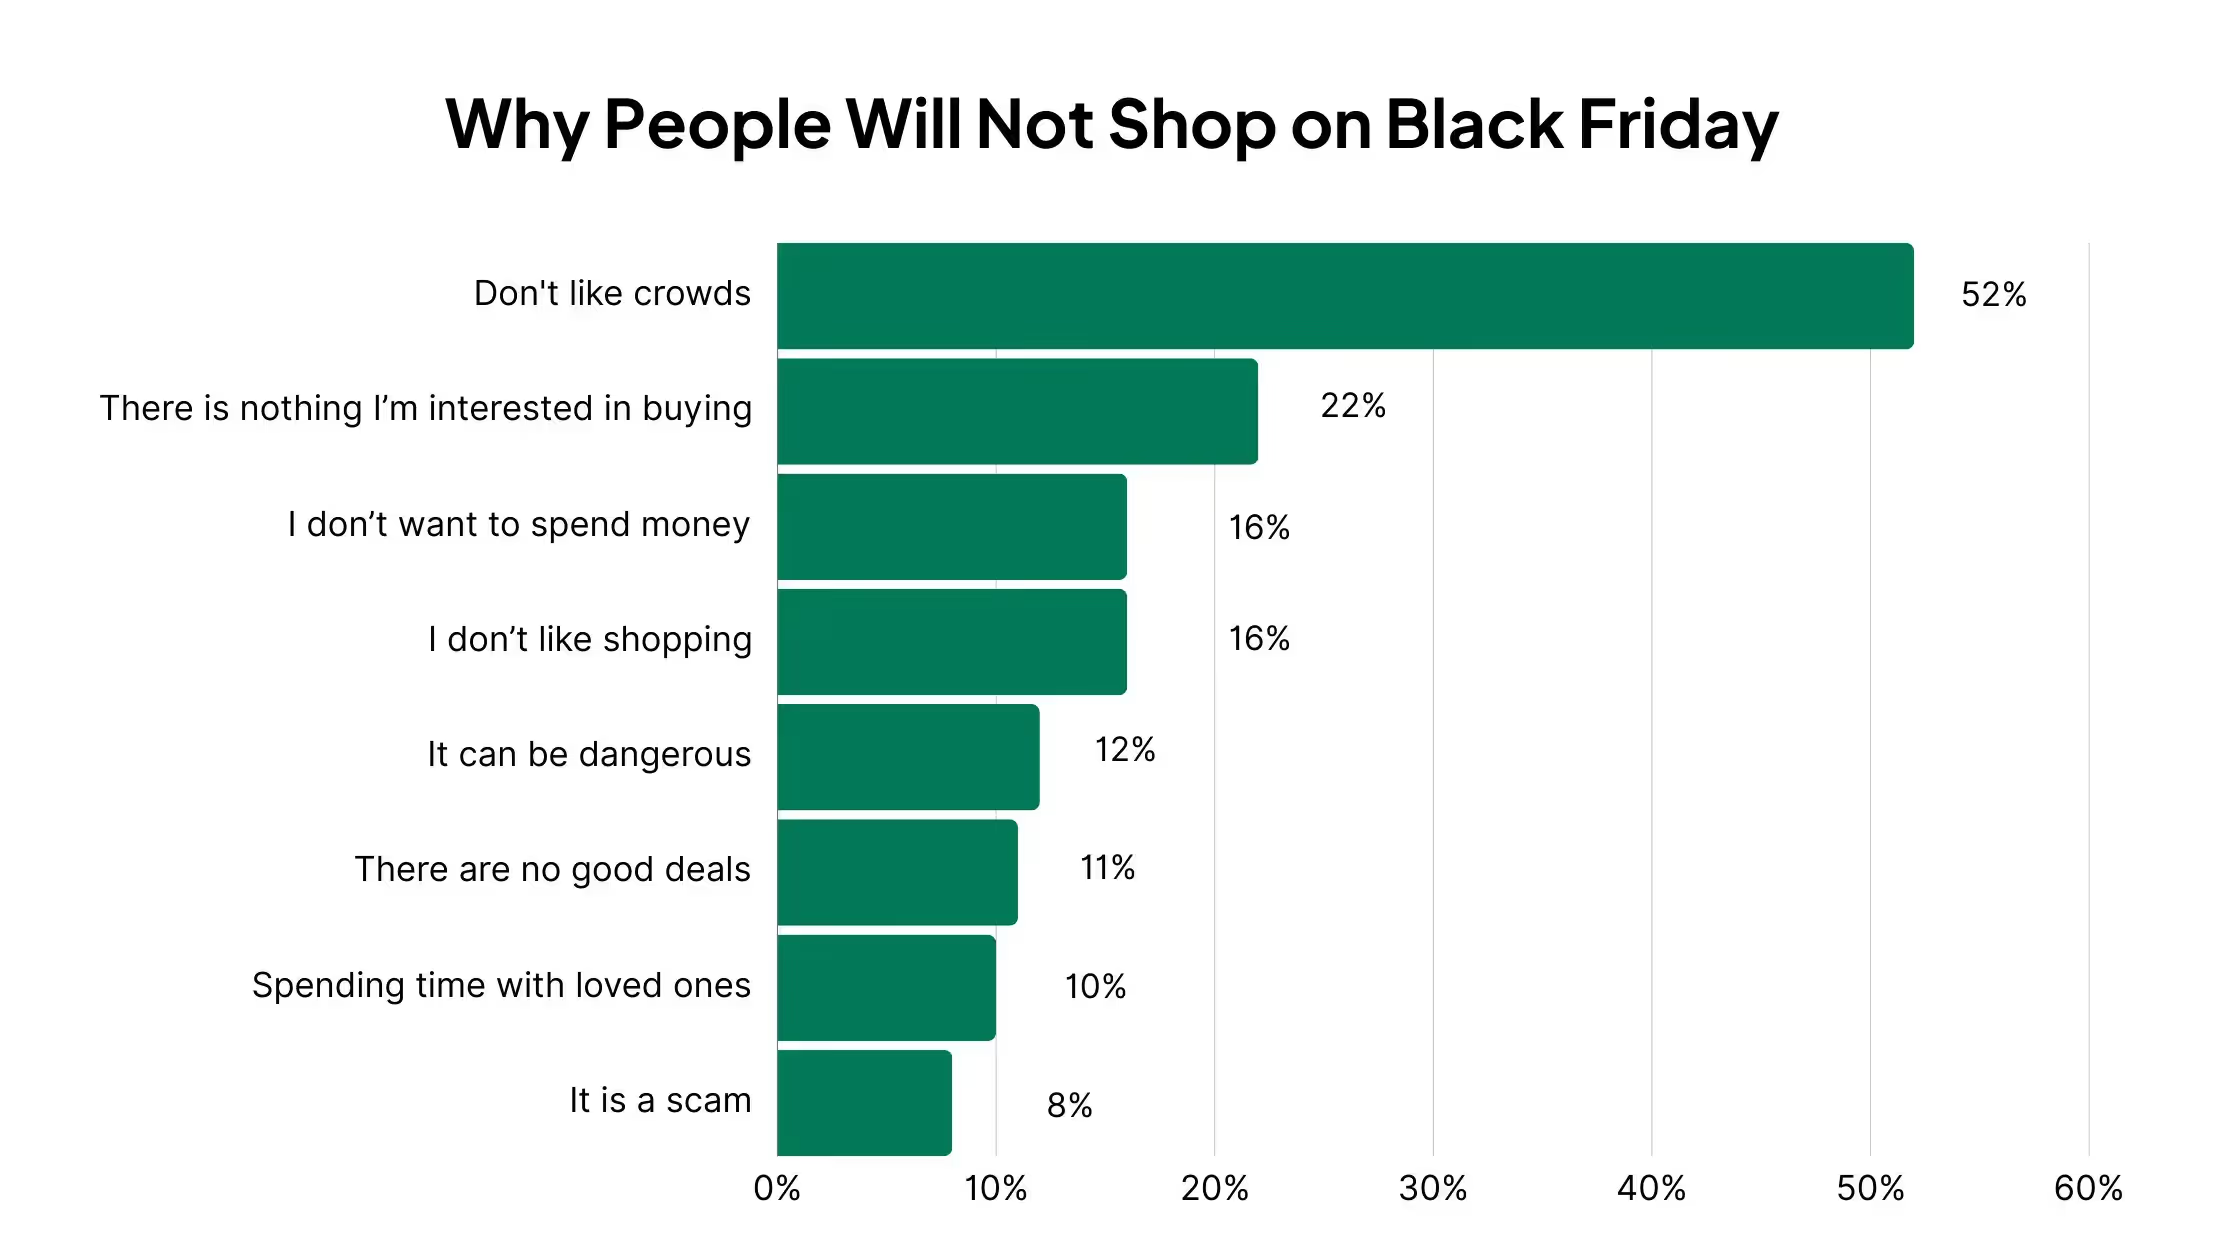
52% of those who don’t plan to shop on BFCM say it’s because they don’t like crowds
For people who don’t plan to shop during Cyber Week, more than half say it’s to avoid crowds.
Some simply aren’t interested in buying anything, or don’t want to spend money, while 8% think that Black Friday is a scam.
Target and Walmart are the top in-person Black Friday shopping destinations
For people who shop in-person on Black Friday, more than two-thirds shop at Target, Walmart or both.
Kohl’s is the next most popular destination, with 41%, while Macy’s, Best Buy and Old Navy are a few other brands that get a spike in business on this date.

88% of people shop on Amazon on Black Friday weekend
Of people who shop online during Cyber Week, nearly all make a stop at Amazon.com.
88% of people report shopping on Amazon at some point during the period. Target (55%) and Walmart (51%) are also popular with the online crowd, as are the websites of some other big brick and mortar brands.

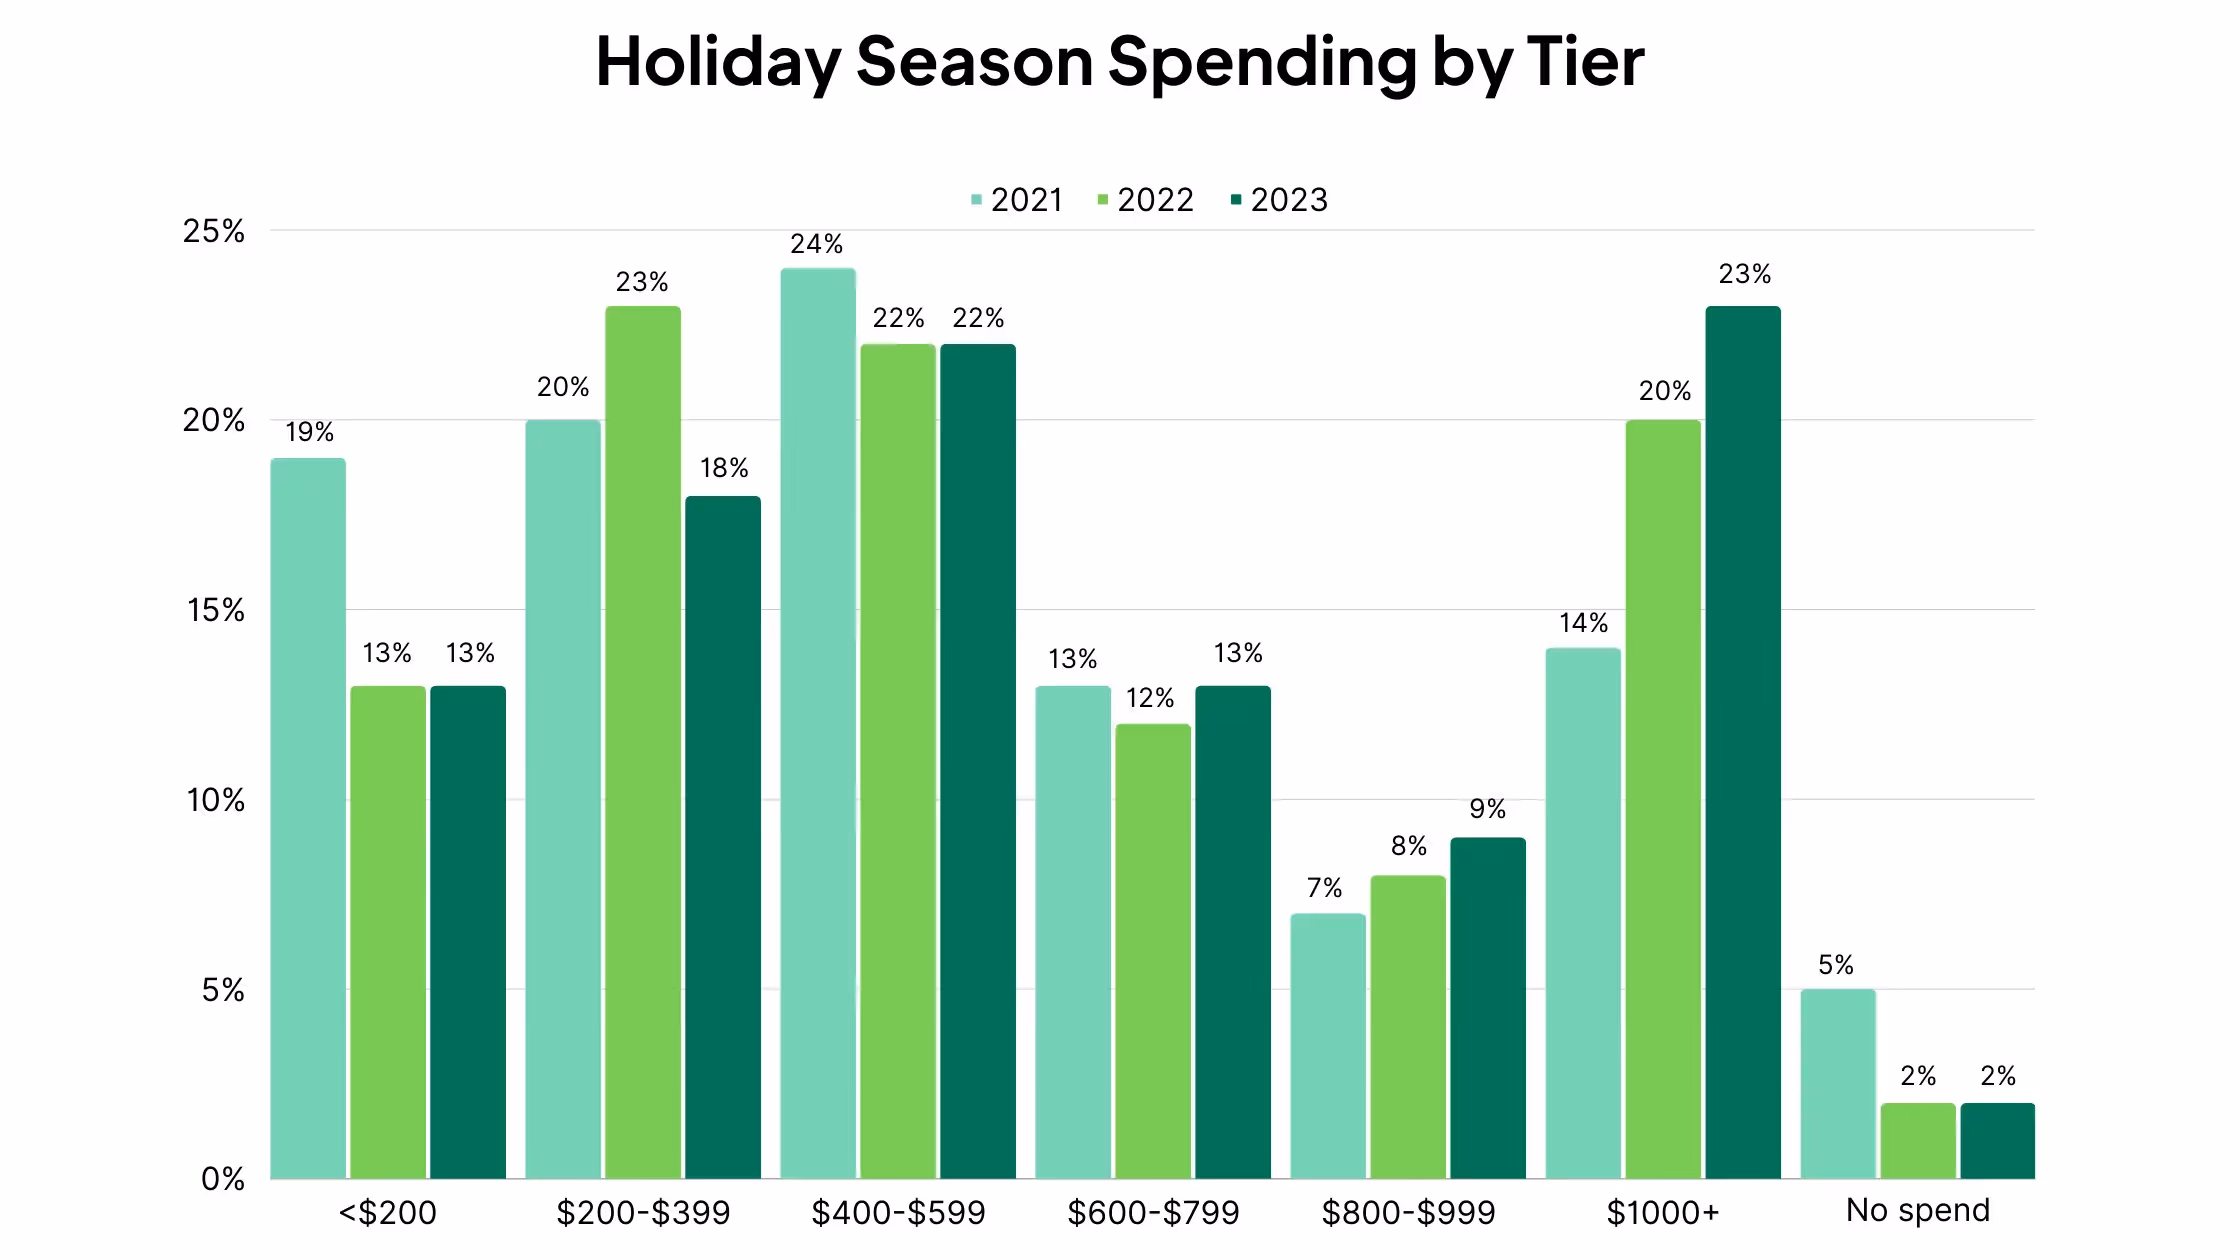
23% of people plan to spend over $1,000 this holiday season
Nearly a quarter of people say they plan to spend more than $1,000 this holiday season. 45% of people claimed they will spend $600 or more.
Consumers spent an average of $321.41 on holiday-related purchases during Thanksgiving weekend
Thanksgiving marks the start of the holiday shopping season, with an average of $321.41 spent on holiday-related items during this period.
Most popular gift purchases include clothing and accessories, toys and gift cards.
55% of people took advantage of pre-Thanksgiving sales
With Black Friday weekend becoming more and more competitive, many brands opt to start their promotions earlier to get in front of the pack.
It seems customers are responsive to this strategy, with 55% of people saying they made a purchase from an early sale or promotion.
Promotions are coming earlier and earlier too, with 35% of people buying something on sale in the week leading up to Thanksgiving, and 24% more than a week before.
Major categories see up to 2-2.5% more sales during Cyber Monday
It’s no surprise that Cyber Monday sales are much higher than the average day.
Most categories see double their regular sales on Cyber Monday, or more. Apparel sales, for example, grow 189% compared to a regular day in October.
Other top-performing categories include appliances (up 166%), toys (up 140%) and furniture (up 129%).

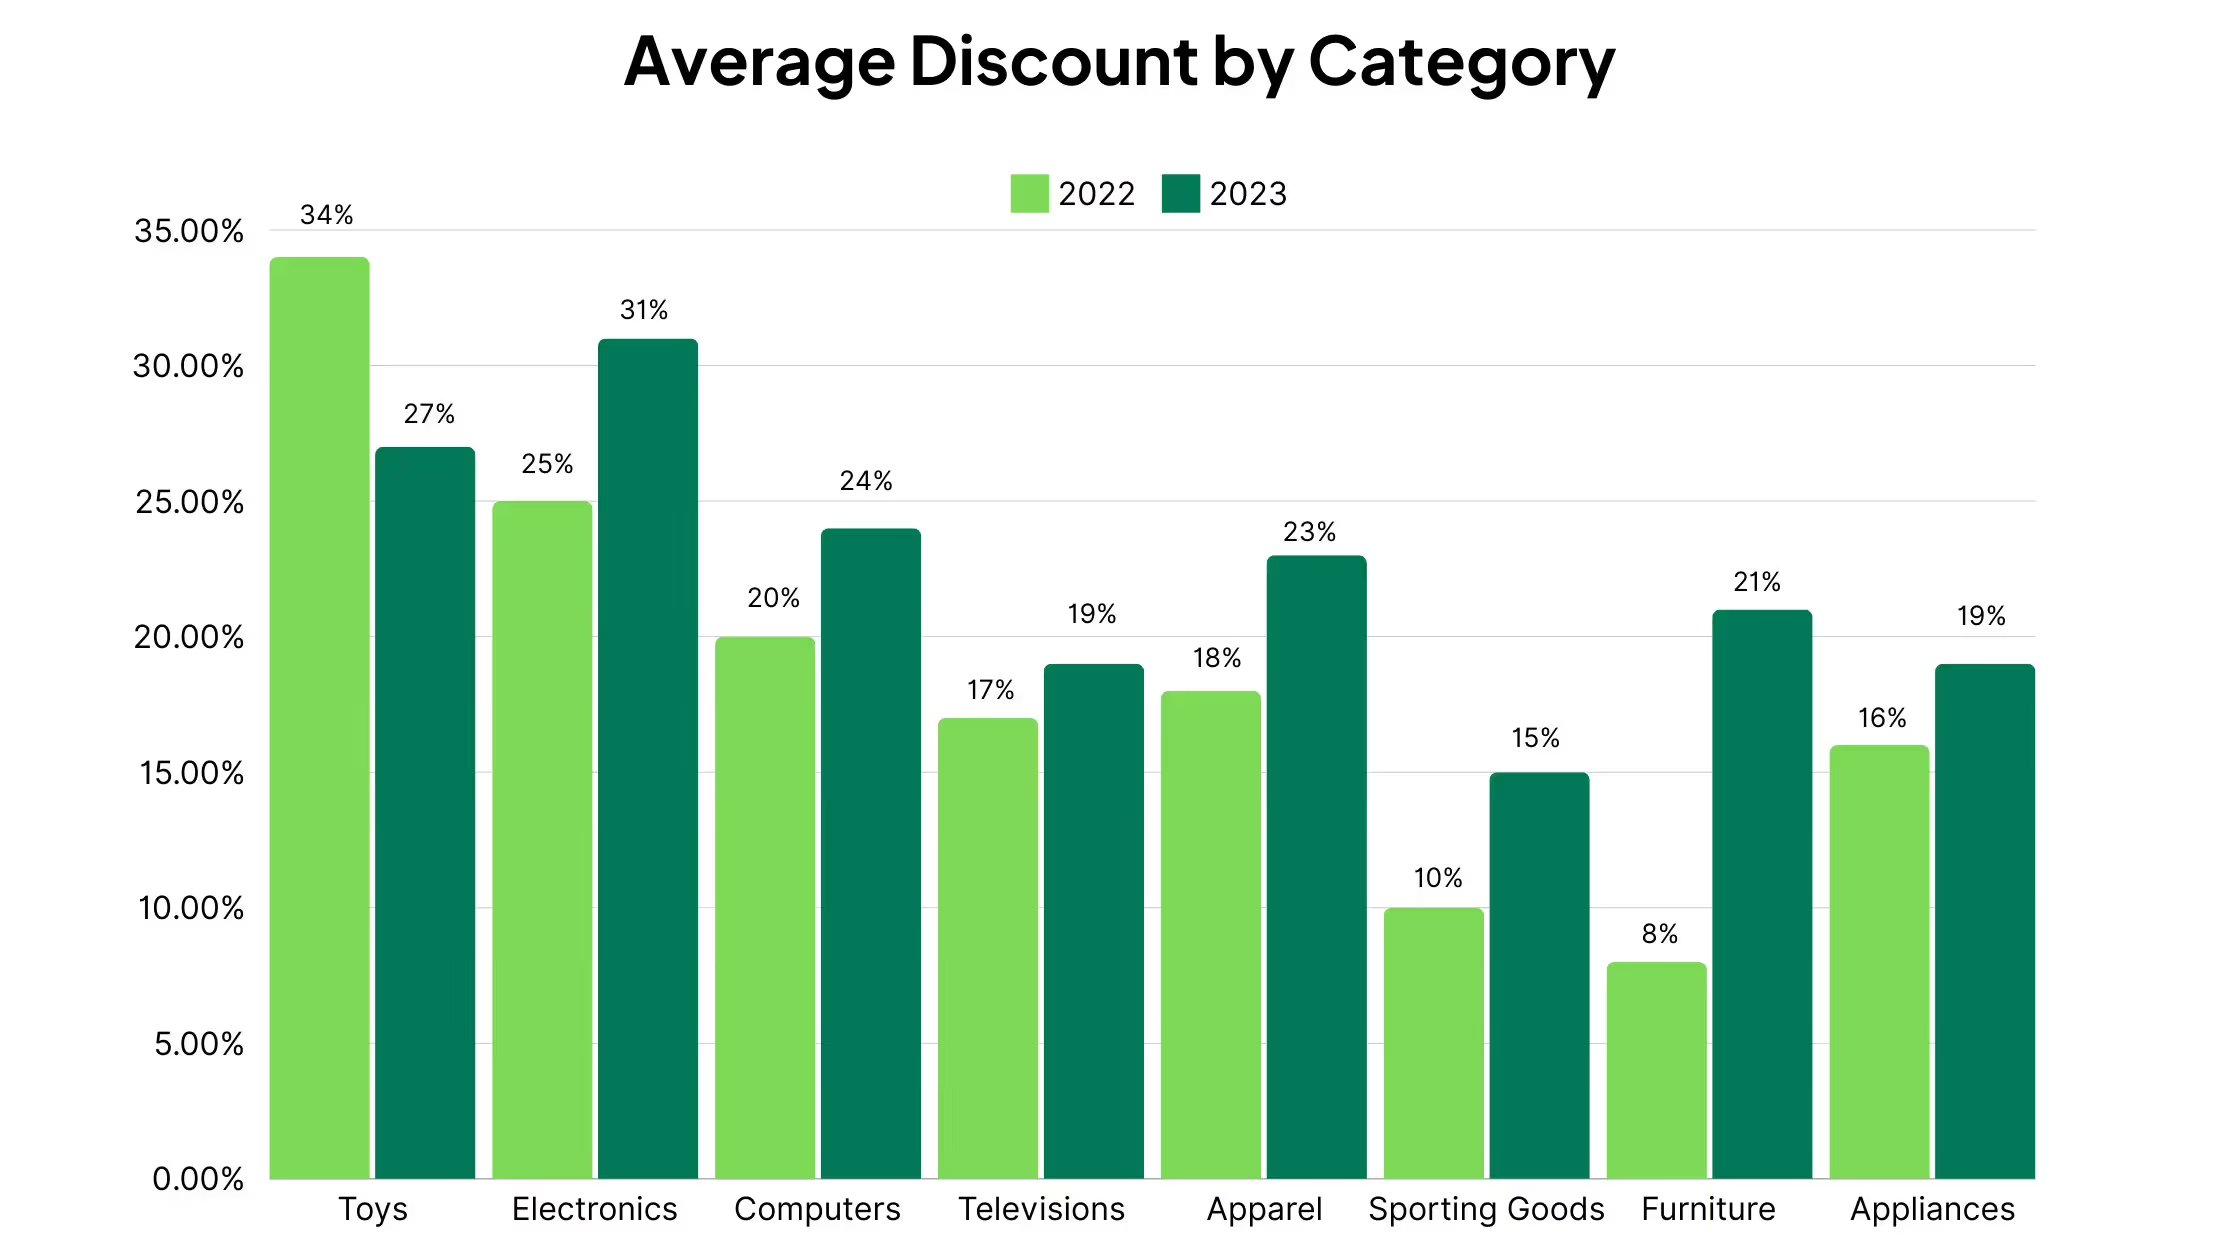
Discounts hit record highs in 2023
Discounts are hitting record highs during Black Friday and the surrounding days.
The average Black Friday discount for electronics was 31% off in 2023, compared to 25% off the year before.
The average discount for furniture increased from 8% in 2022 to 21% in 2023. Apparel, sporting goods, televisions and appliances all saw higher discounts as well, while the average discount for toys decreased, from 34% in 2022 to 27% in 2023.
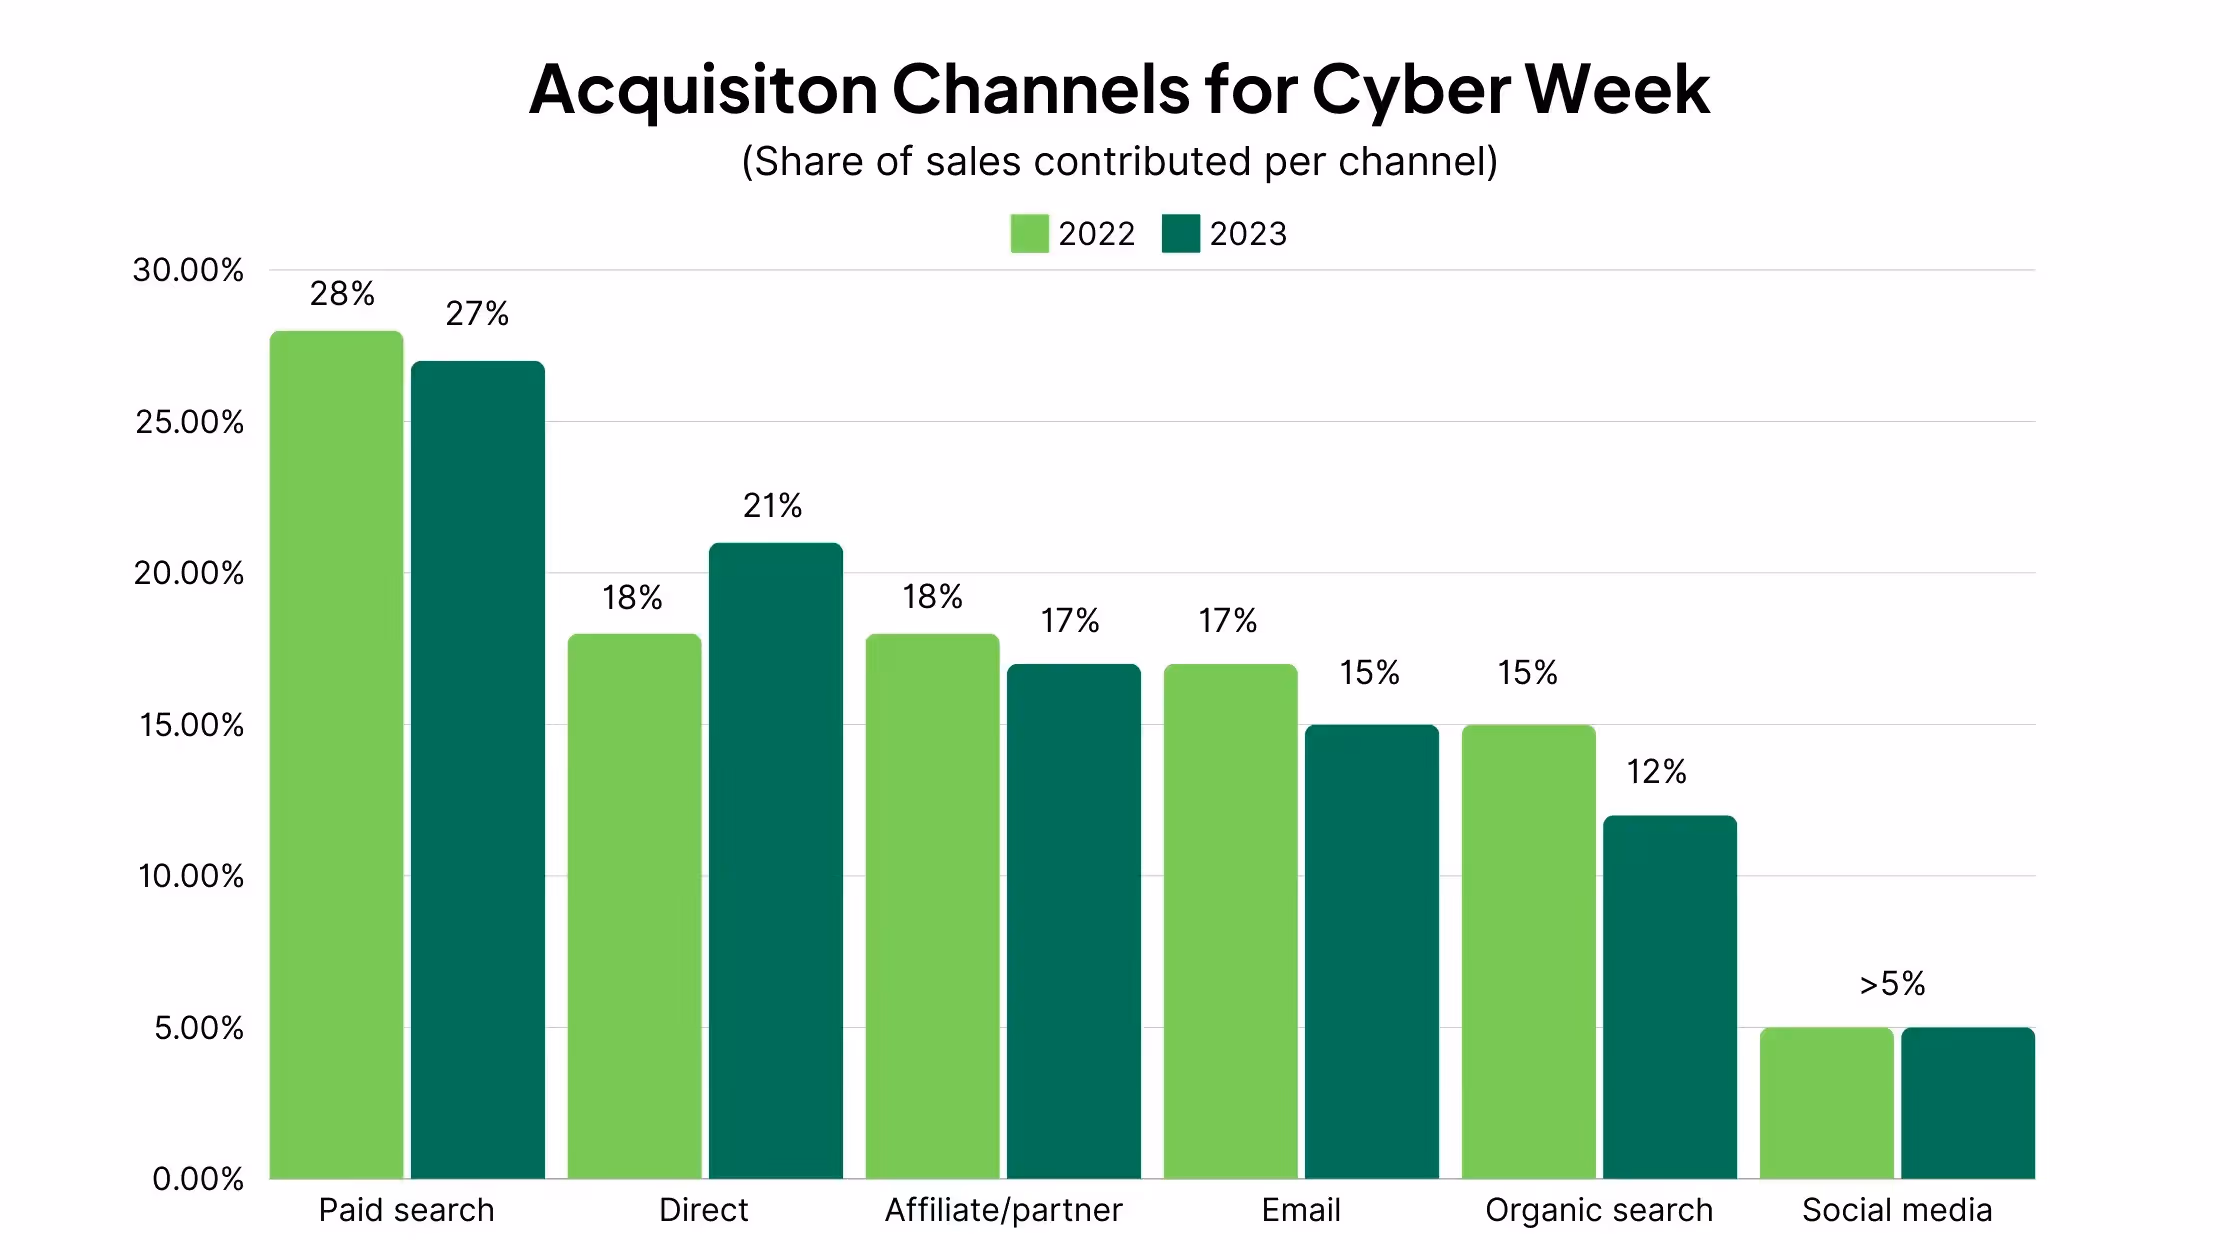
Paid search drives 27% of online sales during Cyber Week
Paid search remains the top marketing channel for Cyber Week, driving 27% of online sales from Thanksgiving through to Cyber Monday.
However, this number is down slightly from 28% on 2022.
Direct is the #2 channel, with 21% share of sales. Organic search, email and affiliate are all fairly evenly distributed, while social media drives less than 5% of all Cyber Week sales.
Black Friday Trends: Three Predictions for the Future of Black Friday
The Black Friday figures above paint interesting reading on the current state of Black Friday, Cyber Monday and the overall Thanksgiving sales period.
But how about the future of BFCM? What do these stats tell us about what Black Friday-Cyber Monday will look like next year, five years, ten years from now?
Here are three predictions for how Black Friday will evolve in the coming years.
- More sales on mobile: mobile commerce is growing at a fast rate, driving the majority of sales in the US, and 70% of all online sales worldwide. With mobile shopping experiences getting better every year, expect this trend to continue.
- More early sales: we’ve seen that almost half of all shoppers already take advantage of pre-Thanksgiving sales. With the intense competition and ad costs during Cyber Week, look for more brands to run early promotions, potentially starting as soon as the start of November.
- More brands driving sales through owned channels: paid ads drive more than a quarter of all Cyber Week sales, but the cost of this keeps going up. Expect to see smart brands utilize “owned” channels, where they can drive sales more or less for free - such as email, SMS and push notifications via their mobile apps.
If you're running an ecommerce store, and you don't have an app, you're missing out. Our ecommerce App Revenue Calculator shows just how much your brand can gain from launching your own app.
Sources
The data in this post was sourced from recent Black Friday-Cyber Monday/holiday spending reports from eMarketer Insider Intelligence, the National Retail Federation, Adobe Analytics, Salesforce, and Drive Research.
FAQs
Convert your website into a mobile app


