37 Amazon Statistics for 2024 (Order Volume, Market Share, Amazon Prime and More)


Looking for the latest, most insightful, craziest Amazon statistics? We’ve got it all for you right here.
The company has come a long way from its beginnings in Jeff Bezos’ garage. Amazon is now the biggest name in eCommerce, and one of the biggest companies in the world, as you’ll see from the statistics that are to follow.
Stick around and buckle in for all the latest data behind the company that reinvented online shopping.
Want to learn more? Check out this video from our YouTube channel:
Amazon’s Market Share
Let’s start with proof of Amazon’s dominance over the eCommerce industryAmazon has 37.8% of the US eCommerce market share. No other company has more than 10%, with their closest rival, Walmart, at just 6.3%.

It’s not just online where Amazon controls a significant portion of the market. They hold 10.4% of the overall retail market share in the United States, second only to Walmart.

Worldwide, Amazon also ranks top when it comes to eCommerce. Statista reports that Amazon.com accounts for more than 20% of all desktop visits to online shopping marketplaces, while Similarweb shows Amazon.com as the #1 eCommerce website in the world in terms of monthly visits.

Amazon Revenue, GMV, Order Volume and User Statistics
How does being the #1 eCommerce site in the world look in terms of revenue and orders?
Let’s have a look at a few key statistics you need to know.
Amazon Made $513.98 Billion Net Revenue in 2022
Amazon’s yearly net revenue totals nearly $514 billion US.

Yet only a little over half of Amazon's revenue actually comes from eCommerce. Per Statista, the company generates $220 billion in net sales revenue from online stores, along with $117.72 billion from services related to third-party sellers (much of which is commission and fulfillment fees).
The rest comes from advertising, subscription services (such as Amazon Prime fees) and revenue from Amazon Web Services (AWS).

Amazon’s Gross Merchandise Value (GMV) Totals $692.8 Billion
If we’re just looking at how much product Amazon goes through, the numbers are staggering.
Worldwide, Amazon does nearly $700 billion in product sales. More than half of this comes from the US marketplace ($362.7 billion GMV, 52.35% of total sales), with Japan coming in second ($64.9 billion GMV, 9.37% of total sales).


Amazon is Still Growing at 10% Year on Year
Though Amazon is already one of the biggest companies in the world, it keeps getting bigger. Among the top 15 eCommerce retail companies in the US, Amazon ranks as the 4th fastest growing company.
The company is projected to grow by 9.9% in 2023, and 11.7% in 2024 - which would put it as the 2nd fastest growing company at that time.

Amazon Ships 1.6 Million Packages Per Day
How many orders does amazon get per day?
Data shows that Amazon ships a massive 1.6 million packages per day.
That’s over 66,000 packages per hour, and over 1,000 per minute.
Small US Businesses Sell More Than 4,000 Items Per Minute on Amazon
Amazon reports that small and medium sized businesses on their platform sell over 4,000 products per minute.
These businesses make up a large portion of the 2 million+ individual sellers on Amazon’s third-party marketplace.
More Than 350 Million Products Are Sold on the Amazon Marketplace
The total number of products on Amazon, including those from third-party sellers, is in excess of 353 million.
Amazon itself sells over 12.2 million products, through Amazon-owned brands such as Amazon Basics.
Amazon Has Over 300 Million Active Users
As of 2022, the number of Amazon users totaled more than 300 million. This includes online shoppers in over 100 countries around the world.
Amazon Sites Have Over 230 Million Unique Visitors Per Month
Amazon websites (including Prime Video and AWS) receive 231 million unique visitors per month. That puts it below only Google, Microsoft and Facebook websites as the companies with the most visitors across all properties in the United States.

The Average American Spends $91.75 on Amazon Per Month
A study by Upgraded Points found that, on average, Americans spend $91.75 on Amazon each month.
The state with the highest monthly Amazon spend was Tennessee, with an average of $124.22 per month.
The study also found that 25% of Americans shop on Amazon more than once a week.
Amazon Prime Statistics
A large reason for Amazon’s success is their subscription service, Amazon Prime, which offers free and fast delivery, exclusive discounts and more.
Let’s look at some of the top statistics that underline the impact of Amazon Prime on the eCommerce landscape.
There are 168 Million Amazon Prime Members in the US
As of 2022, Amazon Prime had over 168 million members in the United States. Approximately half of the US population has a Prime Membership.
More than 76.6 million households in the United States have at least one Amazon Prime membership, which makes up 58% of all US households.

Amazon Prime Has Over 220 Subscribers Worldwide
Worldwide, Amazon Prime subscribers total more than 220 million.
This number has more than doubled since 2018, and increased more than 4.5x from 46 million in 2016.

Amazon Prime Members Spend an Average of $1400 on Amazon Per Year
Data from Statista finds that Amazon Prime members in the US spend, on average, $1400 per year on Amazon.
In comparison, the data showed that non-Prime members spend just $600 per year.
82% of Americans Born Between 1980 and 1989 are Prime Members
A survey by Statista conducted in late 2022 showed that 82% of Americans born in the 1980s have an Amazon Prime membership.
This age group is that most likely to use Amazon Prime, while 80% of millennials reported to be Amazon Prime members.
US Prime Day Sales Topped $12.7 Billion in 2023
Prime Day has become one of the biggest shopping events of the year, reaching close to Black Friday-Cyber Monday in total sales.
2023 was the biggest Prime Day to date, with $12.7 billion in sales during the two-day event spent in the US. For perspective, Cyber Monday accounts for around $11 billion in online sales.
Prime Day sales have tripled since 2018, jumping from $4.1 billion to the current number.

Prime Members Purchased Over 375 Million Items During Prime Day 2023
The first day of 2023’s event turned out to be the biggest single day of sales in Amazon’s history, with over 375 million items purchased by Prime Members worldwide.
This included an aggregate $2.5 billion saved on Prime Day specials compared to regular prices.
The Average Order Value on Prime Day 2023 Was $58.67
The Prime Day orders in 2023 averaged $58.67 per order.
This indicates a lot of value for consumers on Prime Day, with the average order value around half the usual AOV for eCommerce of $125.66.
It may be more inline with the overall average order value on Amazon, which aged data puts at $47.31, and is now more likely in the range of $50-$55.
Amazon Mobile Statistics

Amazon, like many eCommerce businesses, is part of a global revolution in which more and more shoppers are choosing to shop on mobile first.
US mobile eCommerce sales are currently around $431 billion per year, and projected to grow to $710 billion by 2025. Mobile commerce makes up approximately 38% of all US digital sales.
To no surprise, Amazon is ahead of the curve on mobile, with a perfectly responsive and optimized mobile website and a user-friendly mobile app.
Here are some statistics on the Amazon Shopping app and their mobile shopping experience in general.
Amazon Shopping Has 7.7 Million Ratings on the Apple App Store
Considering the small amount of people who write reviews for apps they download, the 7.7 million app store reviews for the Amazon Shopping app gives you an idea of just how many people shop on Amazon via the app on iPhone alone.
And the app has an average rating of 4.8 out of 5. Not bad.
Amazon Shopping Has Over 500 Million Downloads and More Than 3.5 Million Reviews on Google Play
Amazon is clearly popular with Android users too, with over half a billion total downloads and an average rating of 4.2 out of 5.
The Amazon app is one of only five shopping apps with over 500 million downloads from the Google Play Store, alongside AliExpress, Flipkart, Wish and Vivo.com.
The Amazon App is the 3rd Ranked Shopping App in the Apple App Store for the US
The Amazon Shopping app is consistently one of the most downloaded shopping apps in the App Store, particularly in the US.
However, it has faced competition of late from new competitors, with apps from Temu and Shein generating more new downloads to become the top 2 most popular shopping apps in the App Store.
The Amazon App is the 4th Ranked Shopping App in the Google Play Store for the US
It’s a similar story for Android users, with Amazon’s app ranking 4th in the Google Play Store.
This puts it behind Temu and Shein again, as well as Walmart’s shopping app.
The Amazon iPhone App Had 25.46 Million Downloads in 2021
Amazon Shopping ranked #1 in the App Store for shopping apps in 2021 with 25 million new downloads, 8 million ahead of the next highest, Shein.
The Amazon App Had 5.5 Million Downloads in August 2022
Though the Amazon app already has a huge mobile user base, its numbers continue to grow.
Apptopia reported that the app hit a new record for monthly US downloads in August of 2022, when it brought in 5.5 million new downloads - up 65% year-on-year.
The Amazon Shopping App Has an Average of 98 Million Monthly Active Users in the US
Data from Statista states that Amazon’s app has a monthly audience of 98 million active users.
This is not enough to make it the most widely used shopping app in the US, however, as it’s second to Walmart - which has 120 million active users.
Over 150 Million People Shop on the Amazon App Each Year
The Amazon shopping app has 150.6 million total users who use the app at least once a year.
App Users Make Up 42% of Amazon Mobile Visitors
According to data cited in Business Insider, nearly half of Amazon’s smartphone users shop on the app.
App users account for 42% of mobile visits, with the other 58% shopping online via the browser.
App Users Spend 12.8 Billion Minutes Per Month in the Amazon App
The same data cited above shows that Amazon users spend a total of 12.8 billion minutes per month in the app.
Mobile browser users, despite making up more than half of all visits, only average 2.4 billion minutes per month on the Amazon website.
More Fascinating Amazon Statistics
If that’s not enough for you, here are some more incredible Amazon statistics that offer insight into the world’s leader in eCommerce.
Why People Shop on Amazon
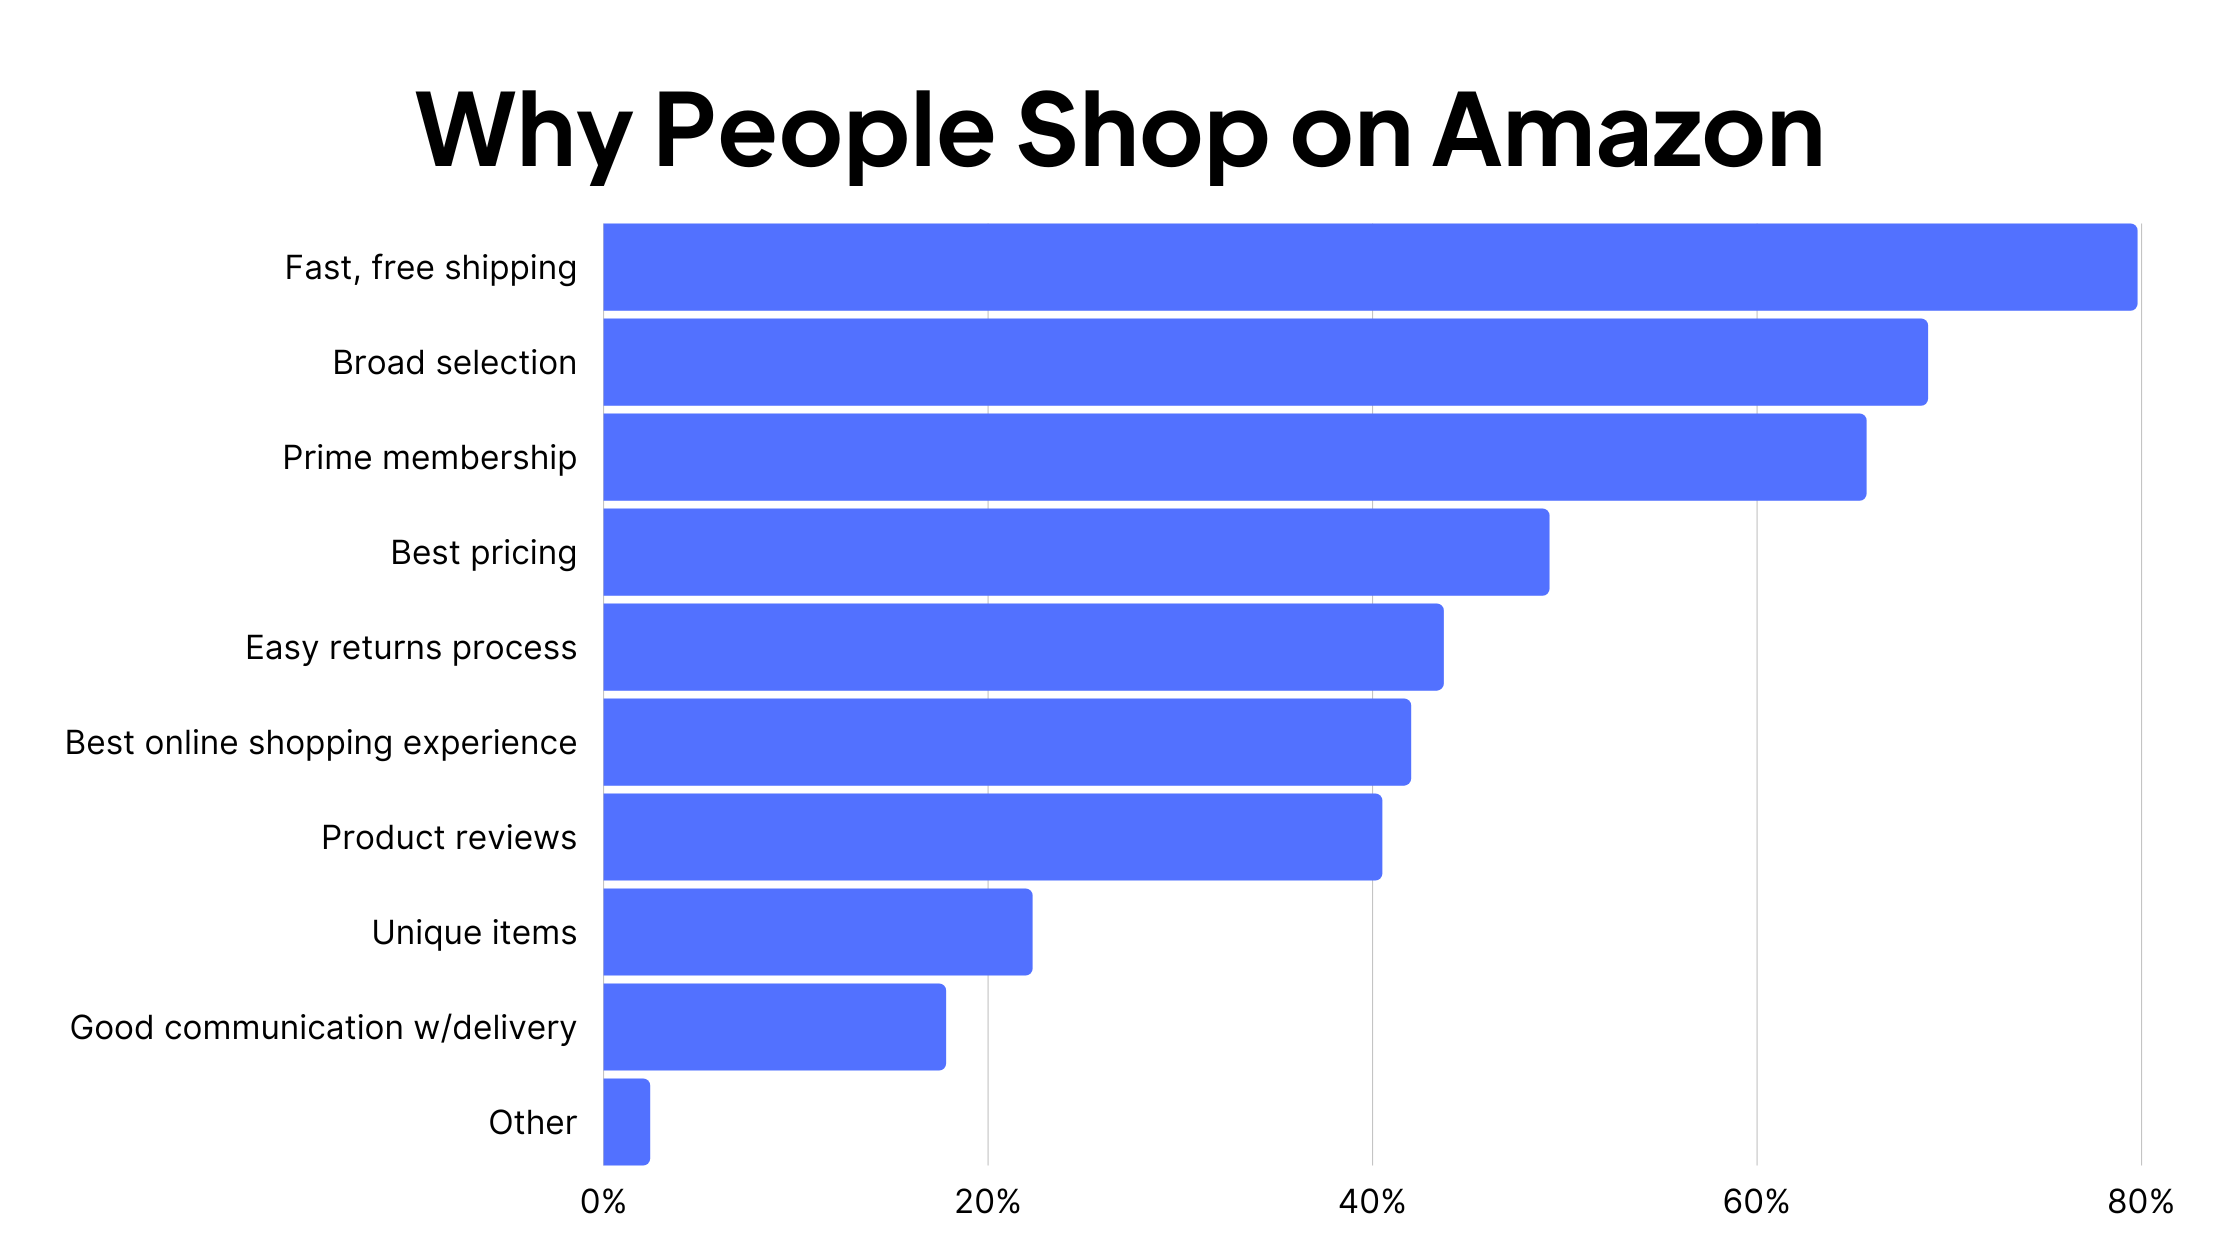
A 2020 study looked at the most popular reasons people give for shopping on Amazon.
The most common reason people buy products from Amazon is for Fast and Free Shipping, a driving factor for 79.8% of Amazon customers.
68.9% of people shop on Amazon because they have a Broad Selection of Products, while 65.7% shop on Amazon because they are a Prime Member.
Third-Party Sellers Account for 59% of Sales on the Amazon Platform
As of the end of 2022, third-party Amazon sellers made up more than half and a little under two-thirds of all sales on the Amazon marketplace.
This share has been steadily increasing each year, rising from 51% at the end of 2017 to 59% now.

15,000 Amazon Sellers Drive Half of Amazon’s Third-Party GMV
Though there are millions of independent sellers operating on the Amazon platform, a small percentage of these sellers bring in a majority of the revenue.
Marketplace Pulse reports that 15,000 Amazon sellers are responsible for nearly half of all third-party marketplace sales.
This small group makes up less than 1% of all Amazon sellers.
While there are 240,000 sellers doing more than 1,000 orders per year, just 15,000 Amazon sellers generate more than 100,000 orders per year each, making up more than 1.5 billion yearly orders in total.
45% of US Brands Sell on Amazon
A Feedvisor study of 1,000 US eCommerce brands found that 45% of brands sell on the Amazon marketplace.
43% of brands reported selling on their own website and 31% also have brick and mortar stores. In terms of competing marketplaces, 25% of brands said they sell on Walmart, and 15% sell on eBay.

75% of Consumers Check Prices on Amazon
Feedvisor’s report finds that for three out of four customers, Amazon is the first place they go to check product information.
75% of people report that, before they make a purchase, they go to Amazon to check prices, reviews and other information.
56% of Consumers Start Their Product Search on Amazon
Over half of consumers start their search for something to buy on Amazon.
For 56% of people, Amazon is step one in the buying journey, well ahead of Google (21%) and Walmart 12%).
Amazon Does $35 Billion in B2B Sales
The growing B2B marketplace Amazon Business is now responsible for $35 billion in annual sales.
This marks strong growth, up from $25 billion in 2020, and just $1 billion in 2016.

Amazon Has Over 400 Private Label Brands Doing More Than $1 Billion in Revenue
Marketplace Pulse revealed that Amazon has at least 406 private label brands. These brands have over 23,000 products in total.
Amazon makes approximately $1 billion in sales from its own private label brands, which represents a small percentage of its overall sales.
Summing Up
Amazon is a great example for any eCommerce brand to follow when it comes to customer experience best practices - the results speak for themselves.
With the e-commerce market share Amazon commands, plus the trust it conveys to consumers, Amazon’s marketplace also presents a great opportunity for Amazon sellers to reach a wider audience and increase their sales (along with the convenience of Amazon FBA for order fulfillment).
Yet it’s unwise to rely entirely on a platform like Amazon, where you don’t have control over your traffic and audience. Brands still need a presence outside Amazon and other third-party marketplaces, where they can communicate directly with their customers and take control over their audience.
Brands should ensure they have their own store, CRO optimized and optimized for mobile shoppers. Better yet, follow Amazon’s lead by building your own mobile app to build an even better connection with your customers on mobile.
To explore how you can create an app for your eCommerce store, for a minor investment and with zero mobile app experience necessary, check out MobiLoud. We help you ship an app that legitimizes your brand, without the hundreds of thousands that building apps usually costs.
Learn more here or get in touch with us to book a free demo, and see how easily you can level up your business with a branded shopping app.
Sources
Amazon.com | Statista | Retail Info Systems | Similarweb | Statista | Statista | ecommercedb | eMarketer | Market.us | 360pi | Investing.com | Statista | CIRP | Statista | Business of Apps | Amazon SMB Impact Report | UpgradedPoints | Statista | Statista | eMarketer | Amazon | Numerator | Statista | Feedvisor | AppFigures | Statista | Business Insider | Apptopia | Statista | MarketplacePulse | Marketplace Pulse | Marketplace Pulse
Since you're already here, did you know that you can get a free preview of your app in 30s? All you need is your website's URL.
Get started with a free account. No credit card required.