What Percentage of Internet Traffic is Mobile? [Updated 2024]


We’re in the grips of a mobile revolution. Smartphones are everywhere, giving just about everyone the ability to go online from anywhere. So with that in mind, what percentage of internet traffic comes on mobile devices today?
If you’re running a business, and need to know where to best focus your efforts to reach the most possible users, pay close attention. If you’re just interested in the state of mobile vs desktop today - keep reading too, as you’re about to get the latest data on the browsing habits of today's internet users.
Internet Usage on Mobile vs Desktop (Latest Stats)
Since 2016, global internet traffic on mobile devices has eclipsed that of desktop computers. The majority of us today prefer the convenience of mobile, being able to go online wherever we are, much quicker than we could by firing up our PC or laptop.
What Percentage of Internet Traffic Comes on Mobile Devices?
Mobile makes up 58.21% of global internet traffic.
Desktop, in comparison, has a 39.76% share of the total web traffic. The remainder comes on tablet, with 2.03% of total online traffic.
Mobile internet traffic was at its highest at 60.73% in July 2022, at which time desktop made up 37% of total traffic.
Mobile Internet Traffic Trends
Let’s see how the share of mobile users vs desktop has changed over the last 10 or so years.
In 2013, mobile internet users made up 16.24% market share, compared to 79.18% for desktop.
Mobile first passed desktop late 2016. In 2018, mobile held 50.88% of website traffic market share, desktop 45.11%, and tablet 4.02%.
Here’s how the data looks year-by-year.
2013: Desktop: 79.18% - Mobile: 16.24% - Tablet: 4.59%
2014: Desktop: 66.57% - Mobile: 27.14% - Tablet: 6.29%
2015: Desktop: 59.17% - Mobile: 35.1% - Tablet: 5.73%
2016: Desktop: 51.37% - Mobile: 43.59% - Tablet: 5.04%
2017: Desktop: 43.75% - Mobile: 51.56% - Tablet: 4.69%
2018: Desktop: 45.11% - Mobile: 50.88% - Tablet: 4.02%
2019: Desktop: 46.04% - Mobile: 50.39% - Tablet: 3.57%
2020: Desktop: 45.64% - Mobile: 51.61% - Tablet: 2.75%
2021: Desktop: 42.31% - Mobile: 55.01% - Tablet: 2.69%
2022: Desktop: 39.43% - Mobile: 58.32% - Tablet: 2.25%
2023: Desktop: 42.88% - Mobile: 55.19% - Tablet: 1.94%
2024: Desktop: 39.41% - Mobile: 58.54% - Tablet: 2.05%
.webp)
Mobile Internet Usage By Region
Now let’s look at how mobile usage differs in various parts of the world. We’ll look at mobile internet traffic in the US, each continent, as well as a range of notable countries worldwide.
Mobile Internet Traffic in the US
In the United States of America, mobile makes up 43.09% of total web traffic.
Desktop leads with 54.25% of total traffic, with tablet taking 2.66%.
Trends: Tablet, Mobile and Desktop Usage in the US
2013: Desktop: 79.79% - Mobile: 13.68% - Tablet: 6.53%
2014: Desktop: 67.89% - Mobile: 23.19% - Tablet: 8.93%
2015: Desktop: 64.67% - Mobile: 26.44% - Tablet: 8.89%
2016: Desktop: 60.61% - Mobile: 30.94% - Tablet: 8.44%
2017: Desktop: 51.1% - Mobile: 40.09% - Tablet: 8.8%
2018: Desktop: 51.2% - Mobile: 40.82% - Tablet: 7.97%
2019: Desktop: 48.45% - Mobile: 44.47% - Tablet: 7.08%
2020: Desktop: 47.84% - Mobile: 47.82% - Tablet: 4.34%
2021: Desktop: 48.88% - Mobile: 47.57% - Tablet: 3.56%
2022: Desktop: 46.43% - Mobile: 50.52% - Tablet: 3.05%
2023: Desktop: 62.21% - Mobile: 35.73% - Tablet: 2.07%
2024: Desktop: 54.25% - Mobile: 43.09% - Tablet: 2.66%
.webp)
Key Statistic: Mobile internet traffic overtook desktop in the US in 2022, and was close to even in 2020-2021. Desktop came back to own higher market share in 2023, and is now trending closer to even again.
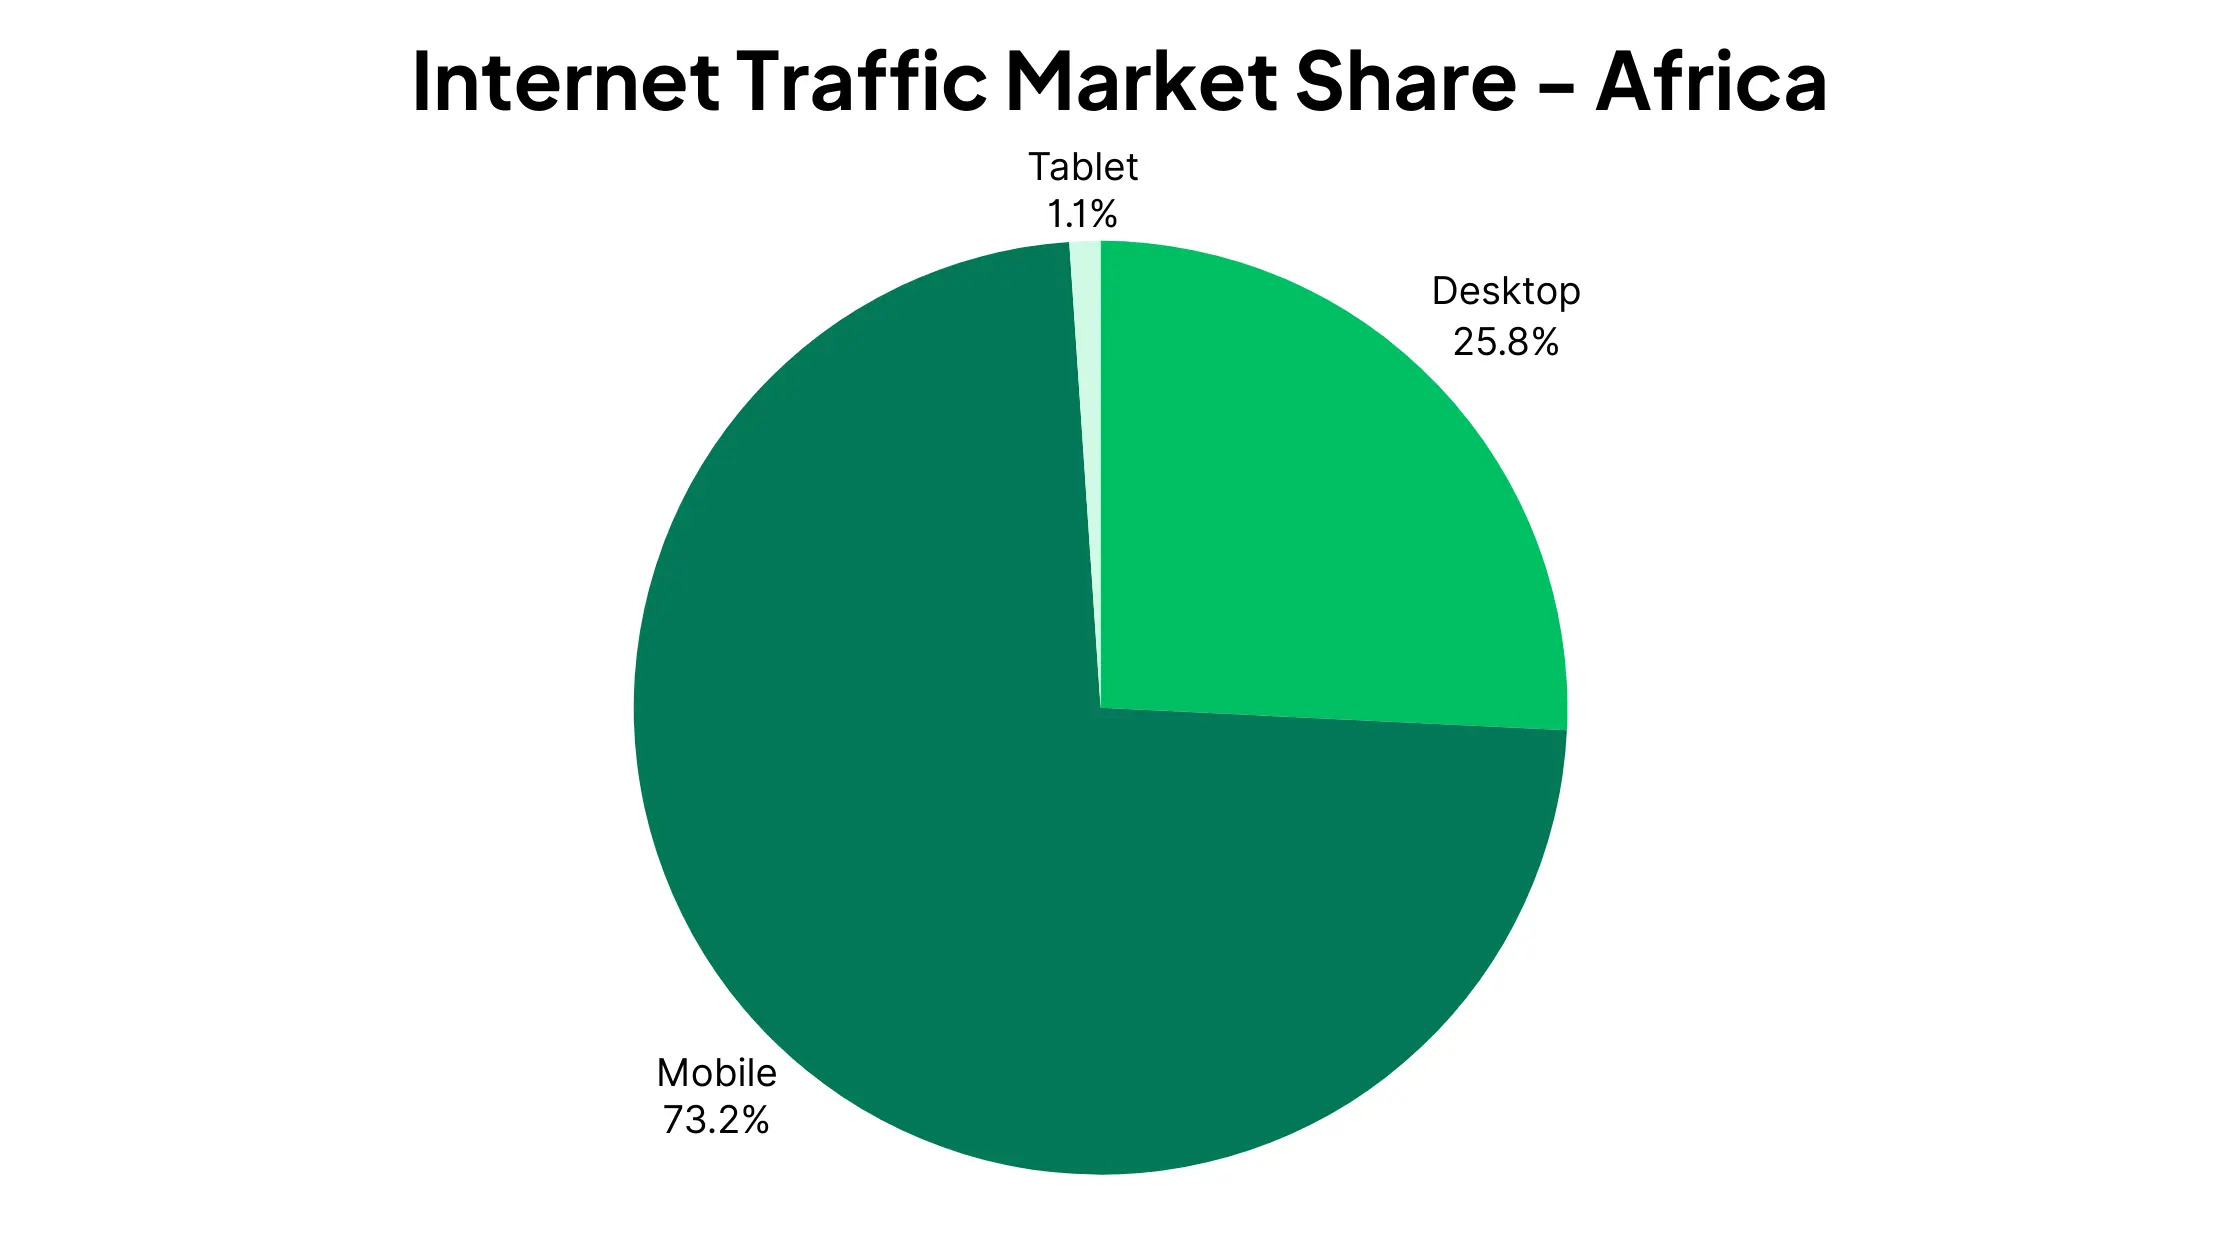
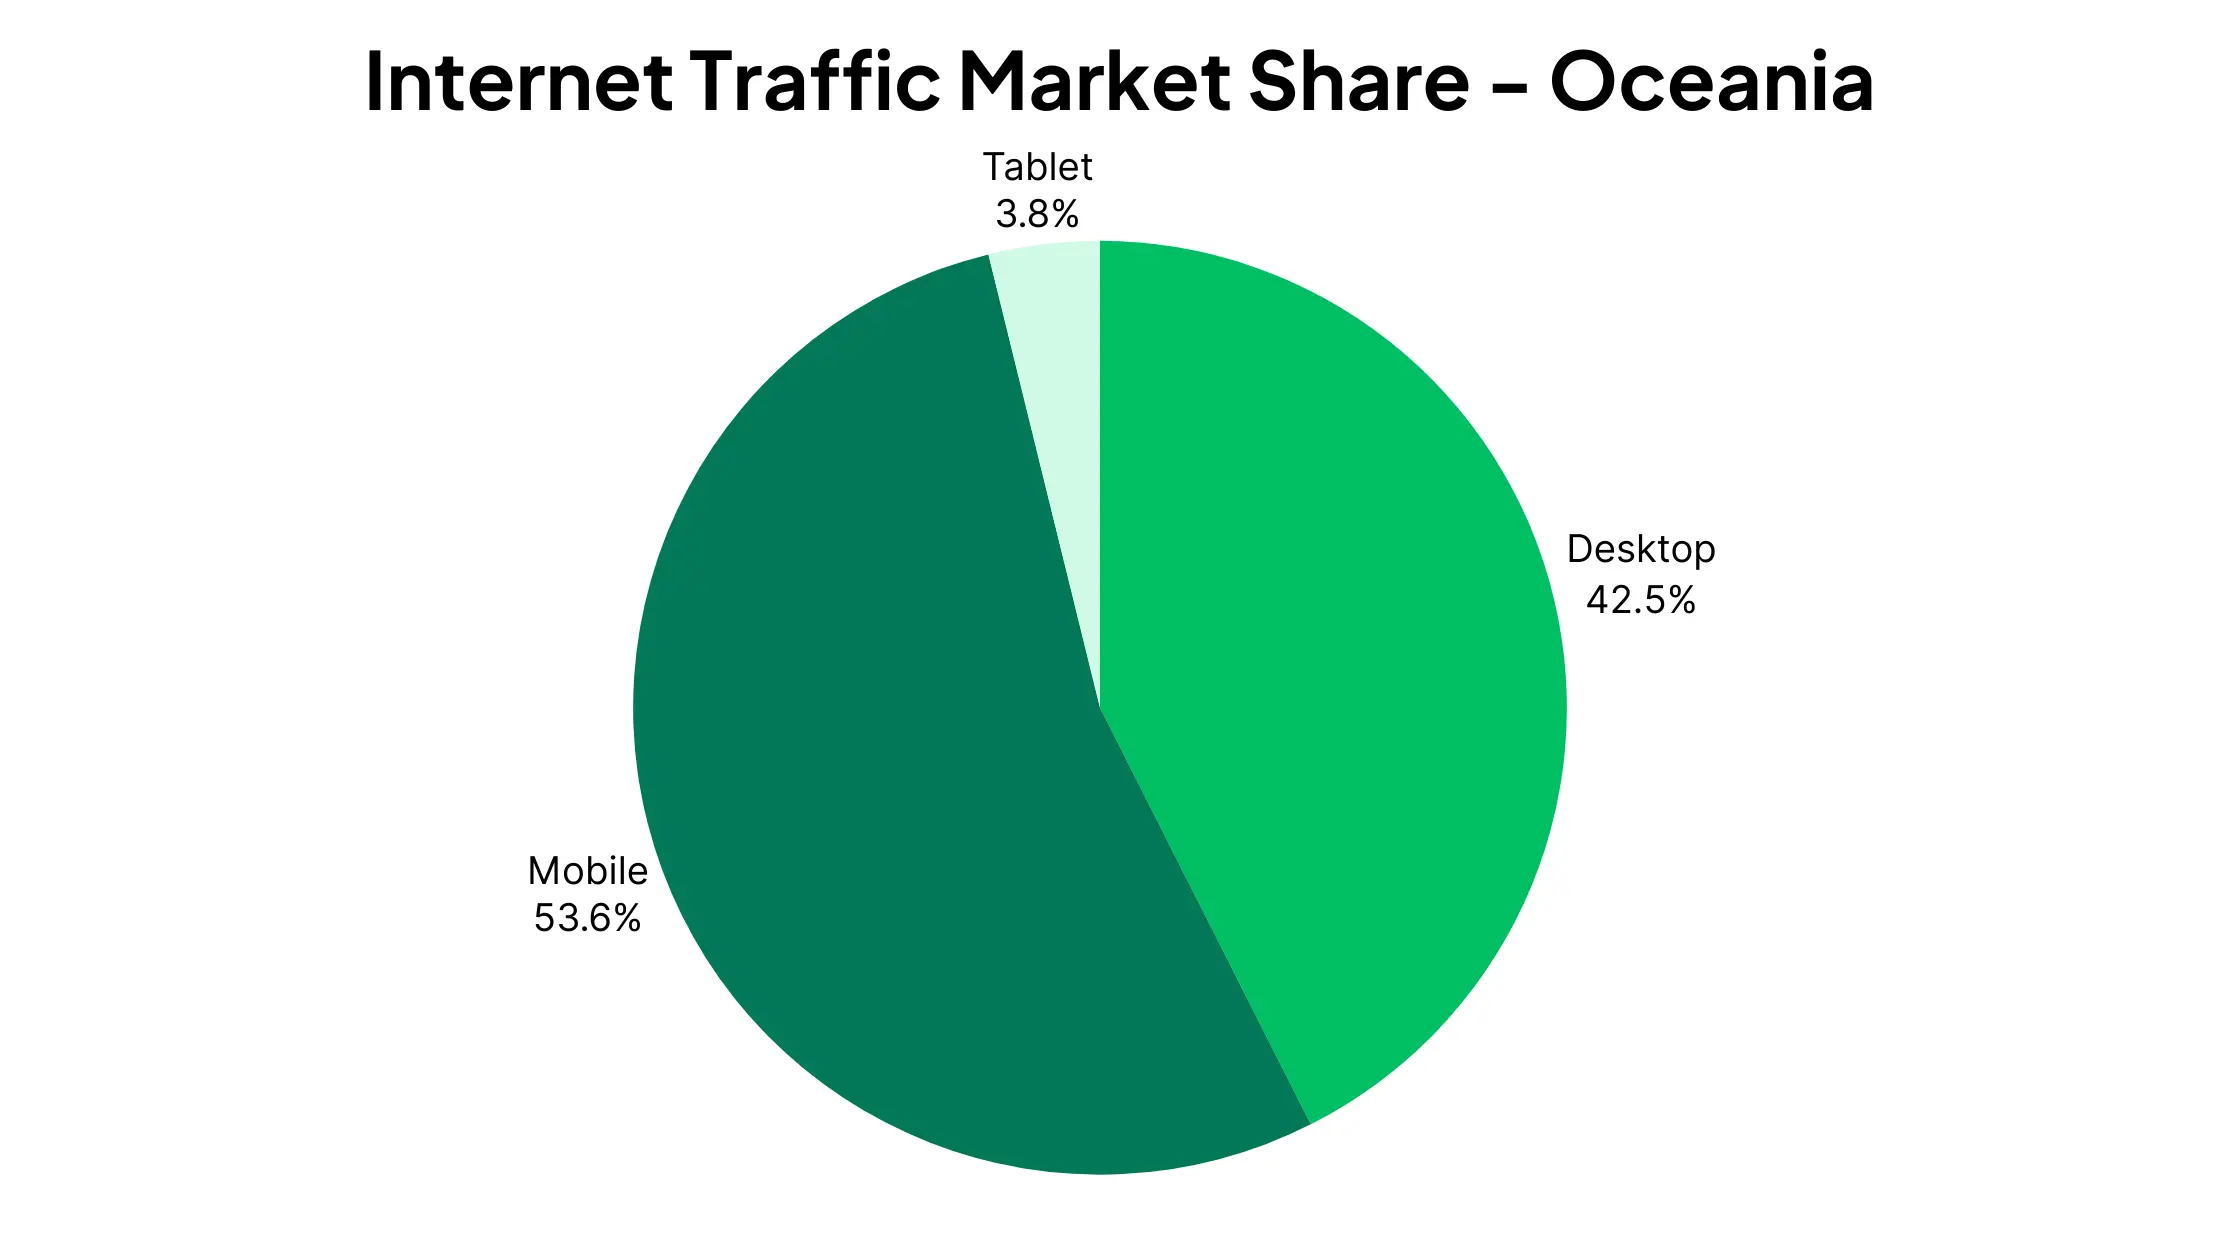
Mobile Traffic by Continent
Here's how the share of internet users on mobile phones breaks down in each continent:


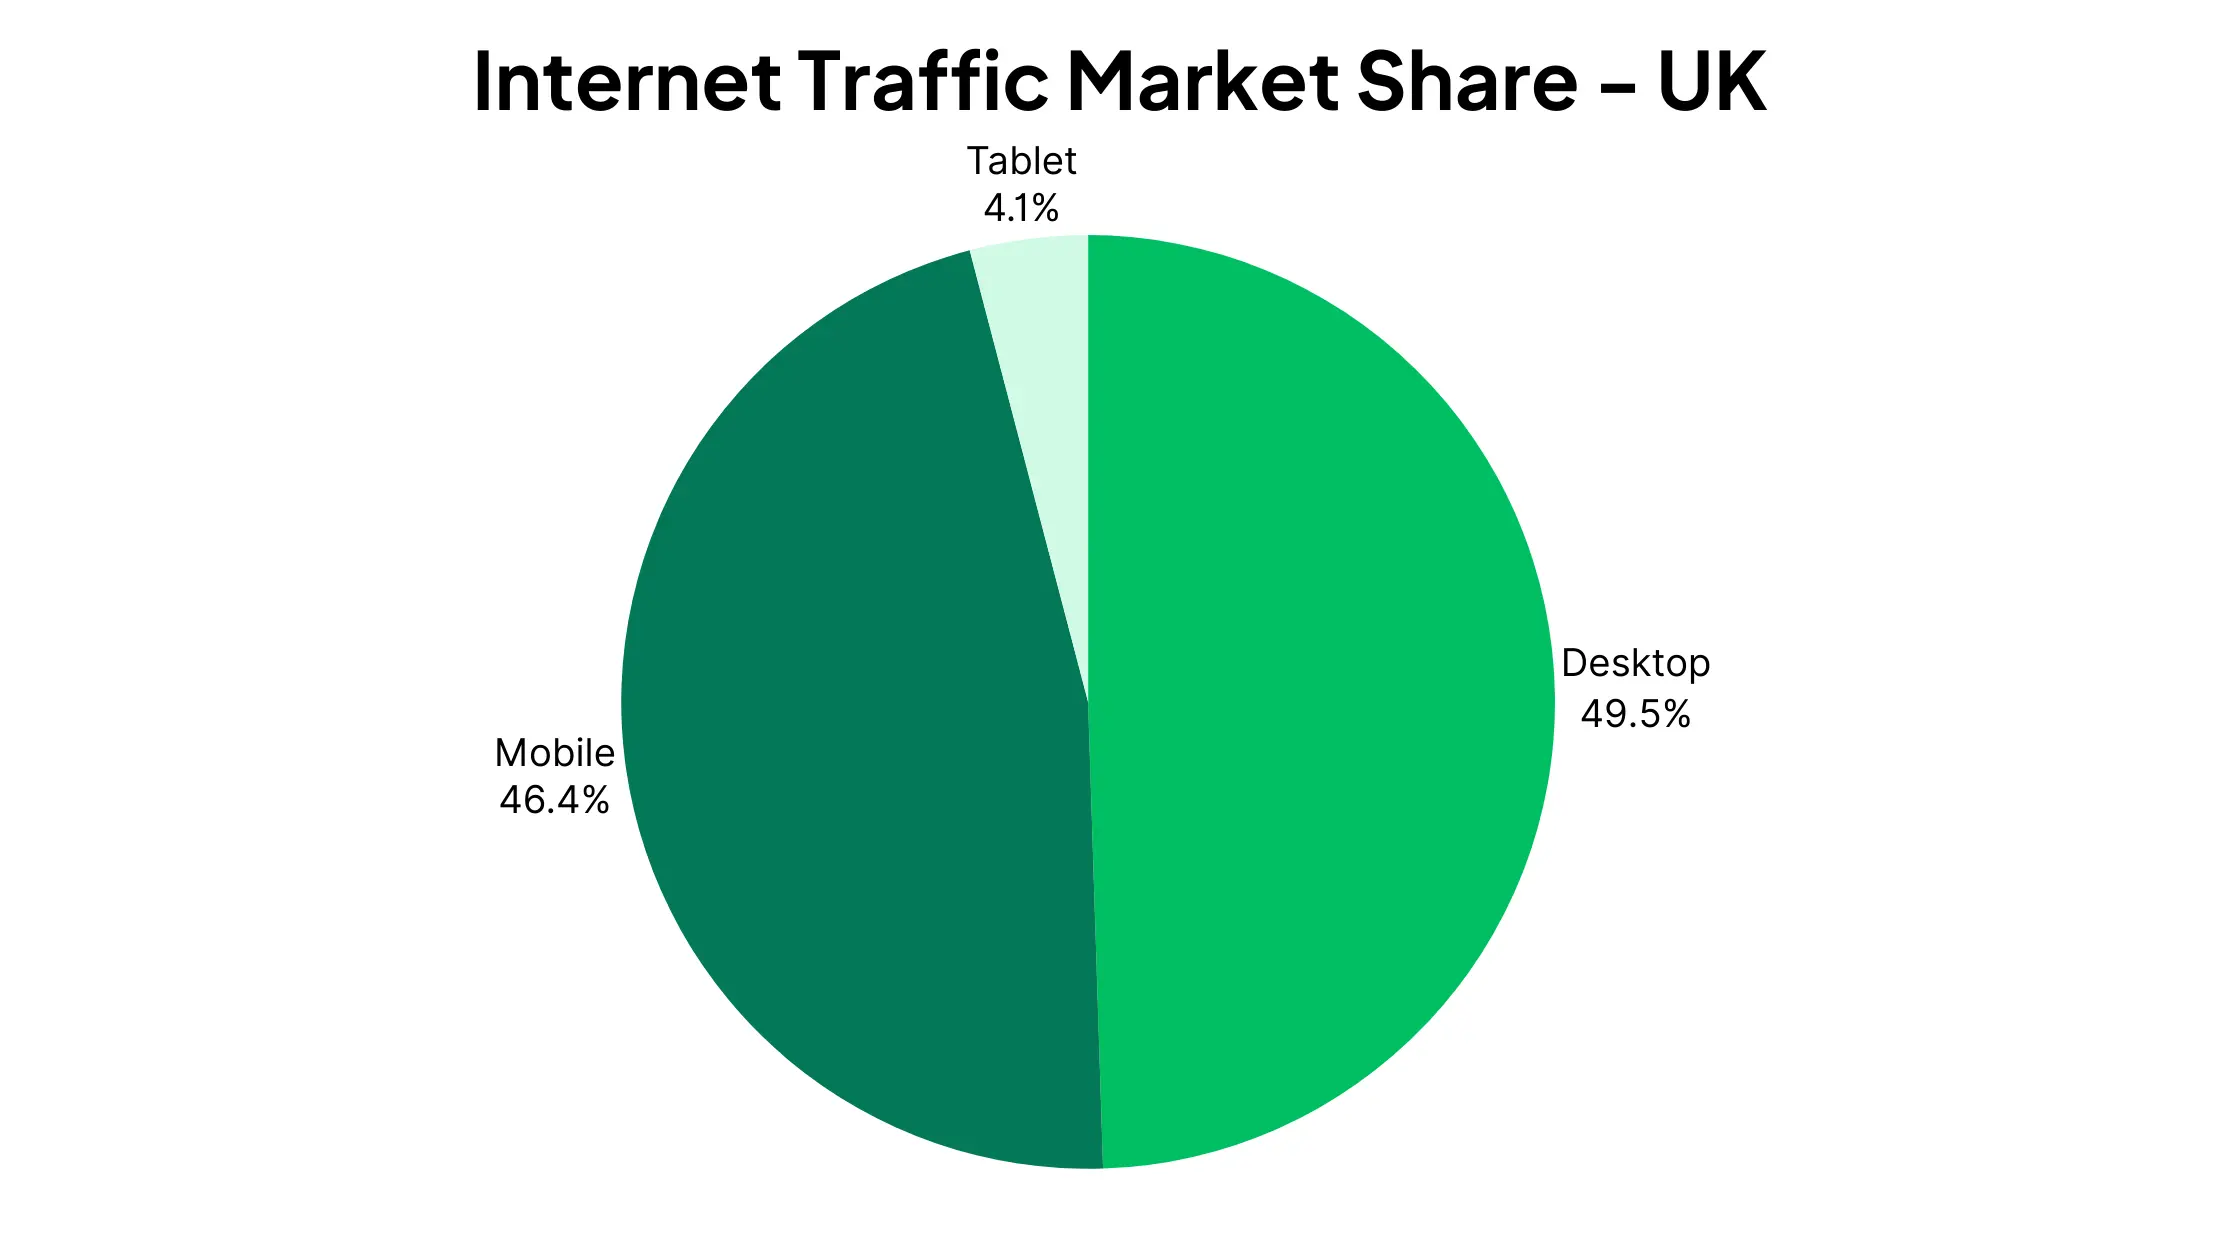
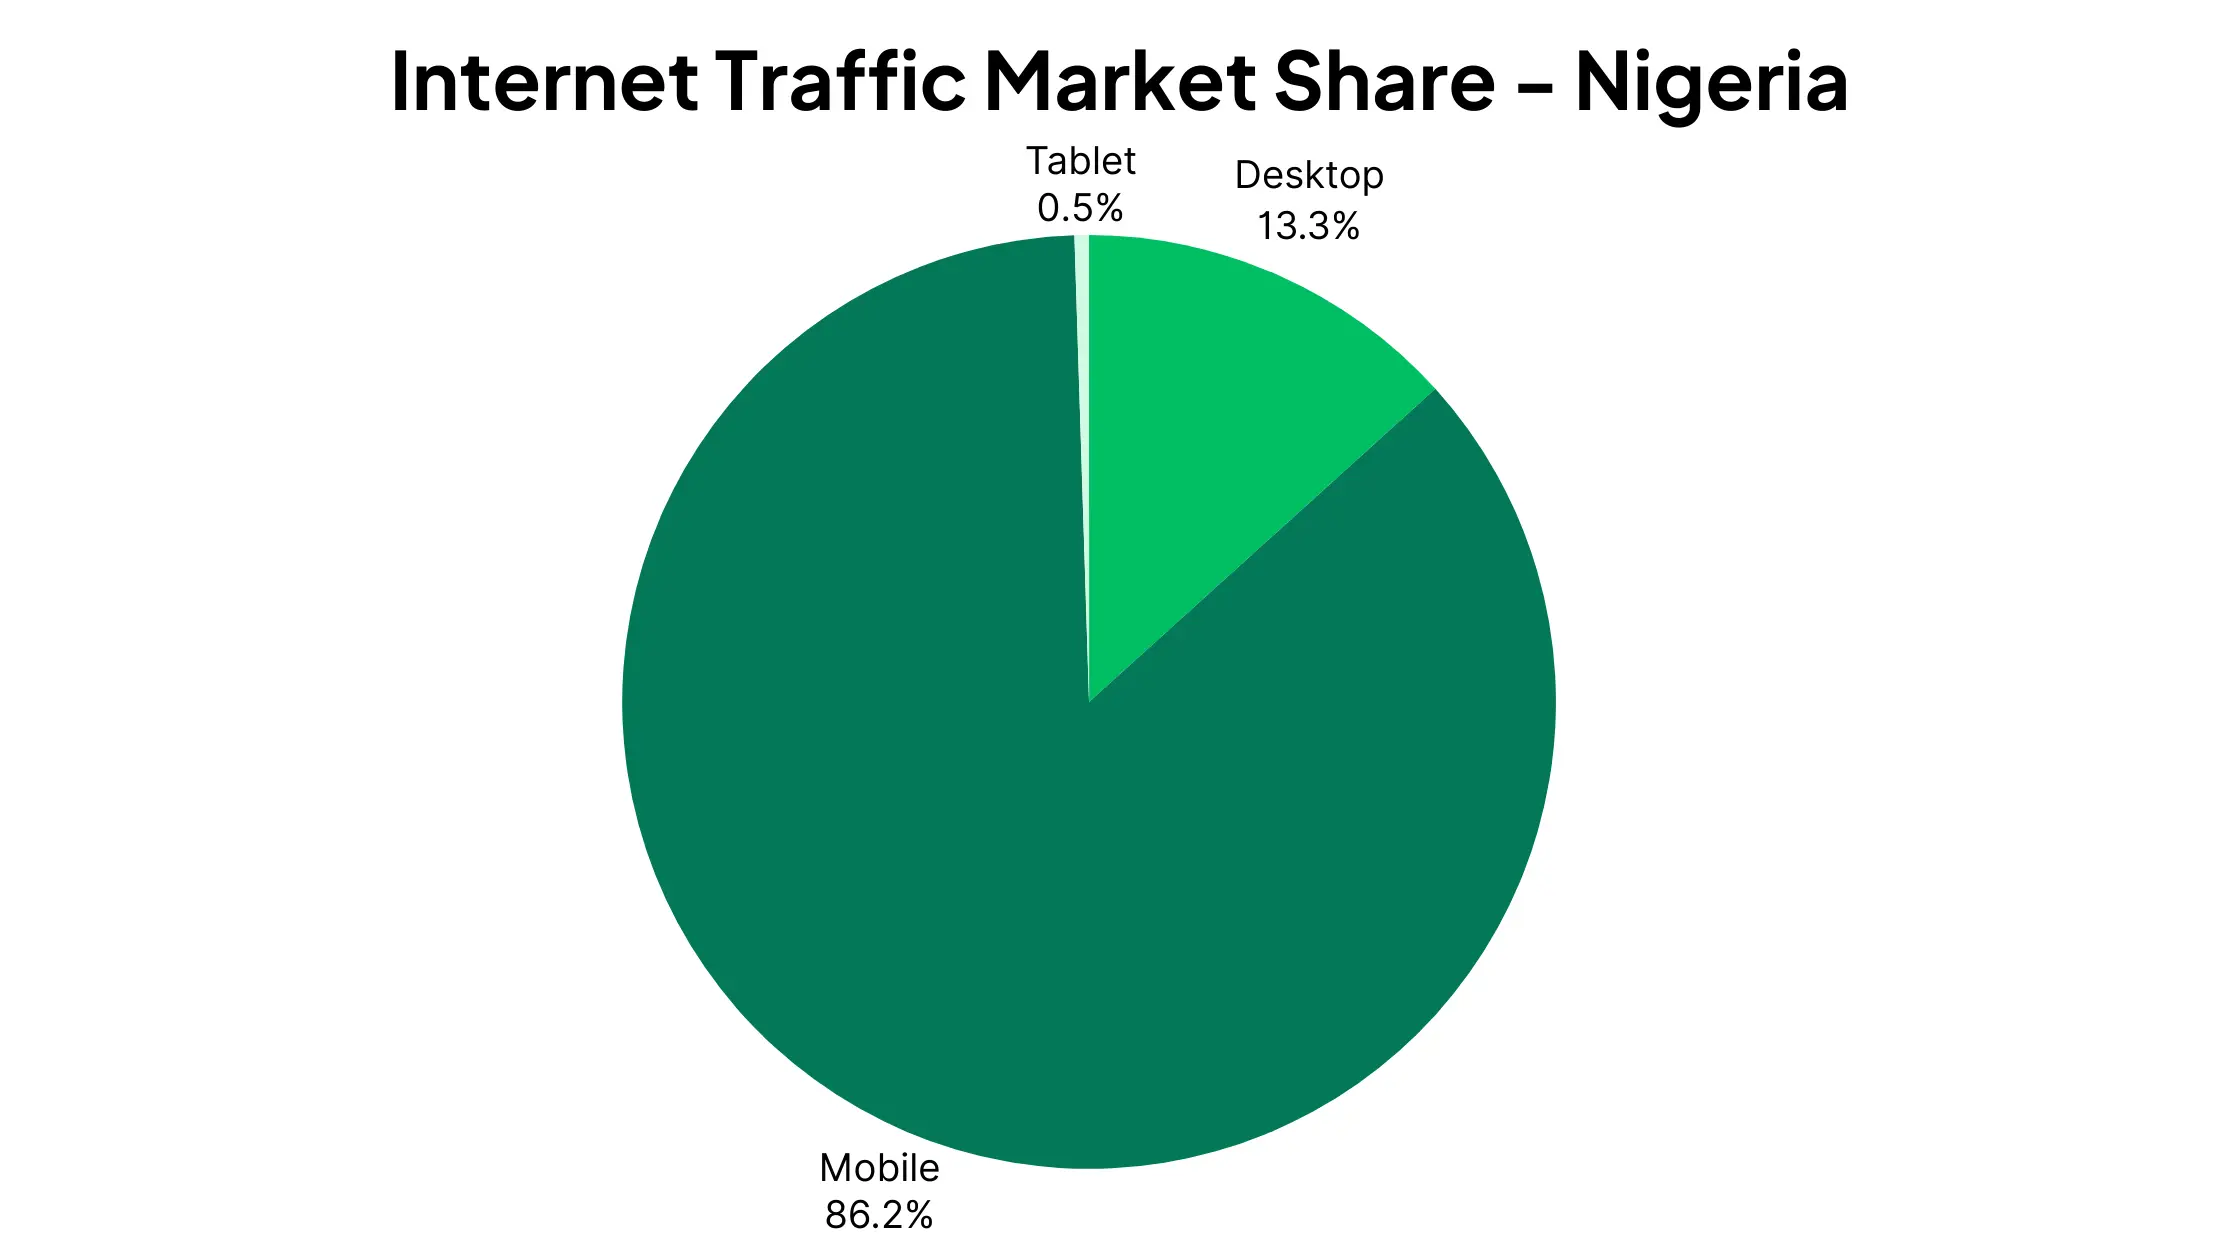
Mobile vs Desktop Market Share by Country
Now let's take a look at some notable countries and what percentage of internet traffic comes on mobile devices.


[Mobile internet market share data sourced from Statcounter]
Mobile vs Desktop Traffic By Location: Key Takeaways
Here are some key takeaways from the browsing habits of different locations across the globe.
- Developing countries tend to have a higher percentage of mobile users, while Western countries (i.e. those in North America, Europe and Oceania), tend to have more desktop users.
- Africa is the top continent for mobile internet usage, while Oceania is the lowest.
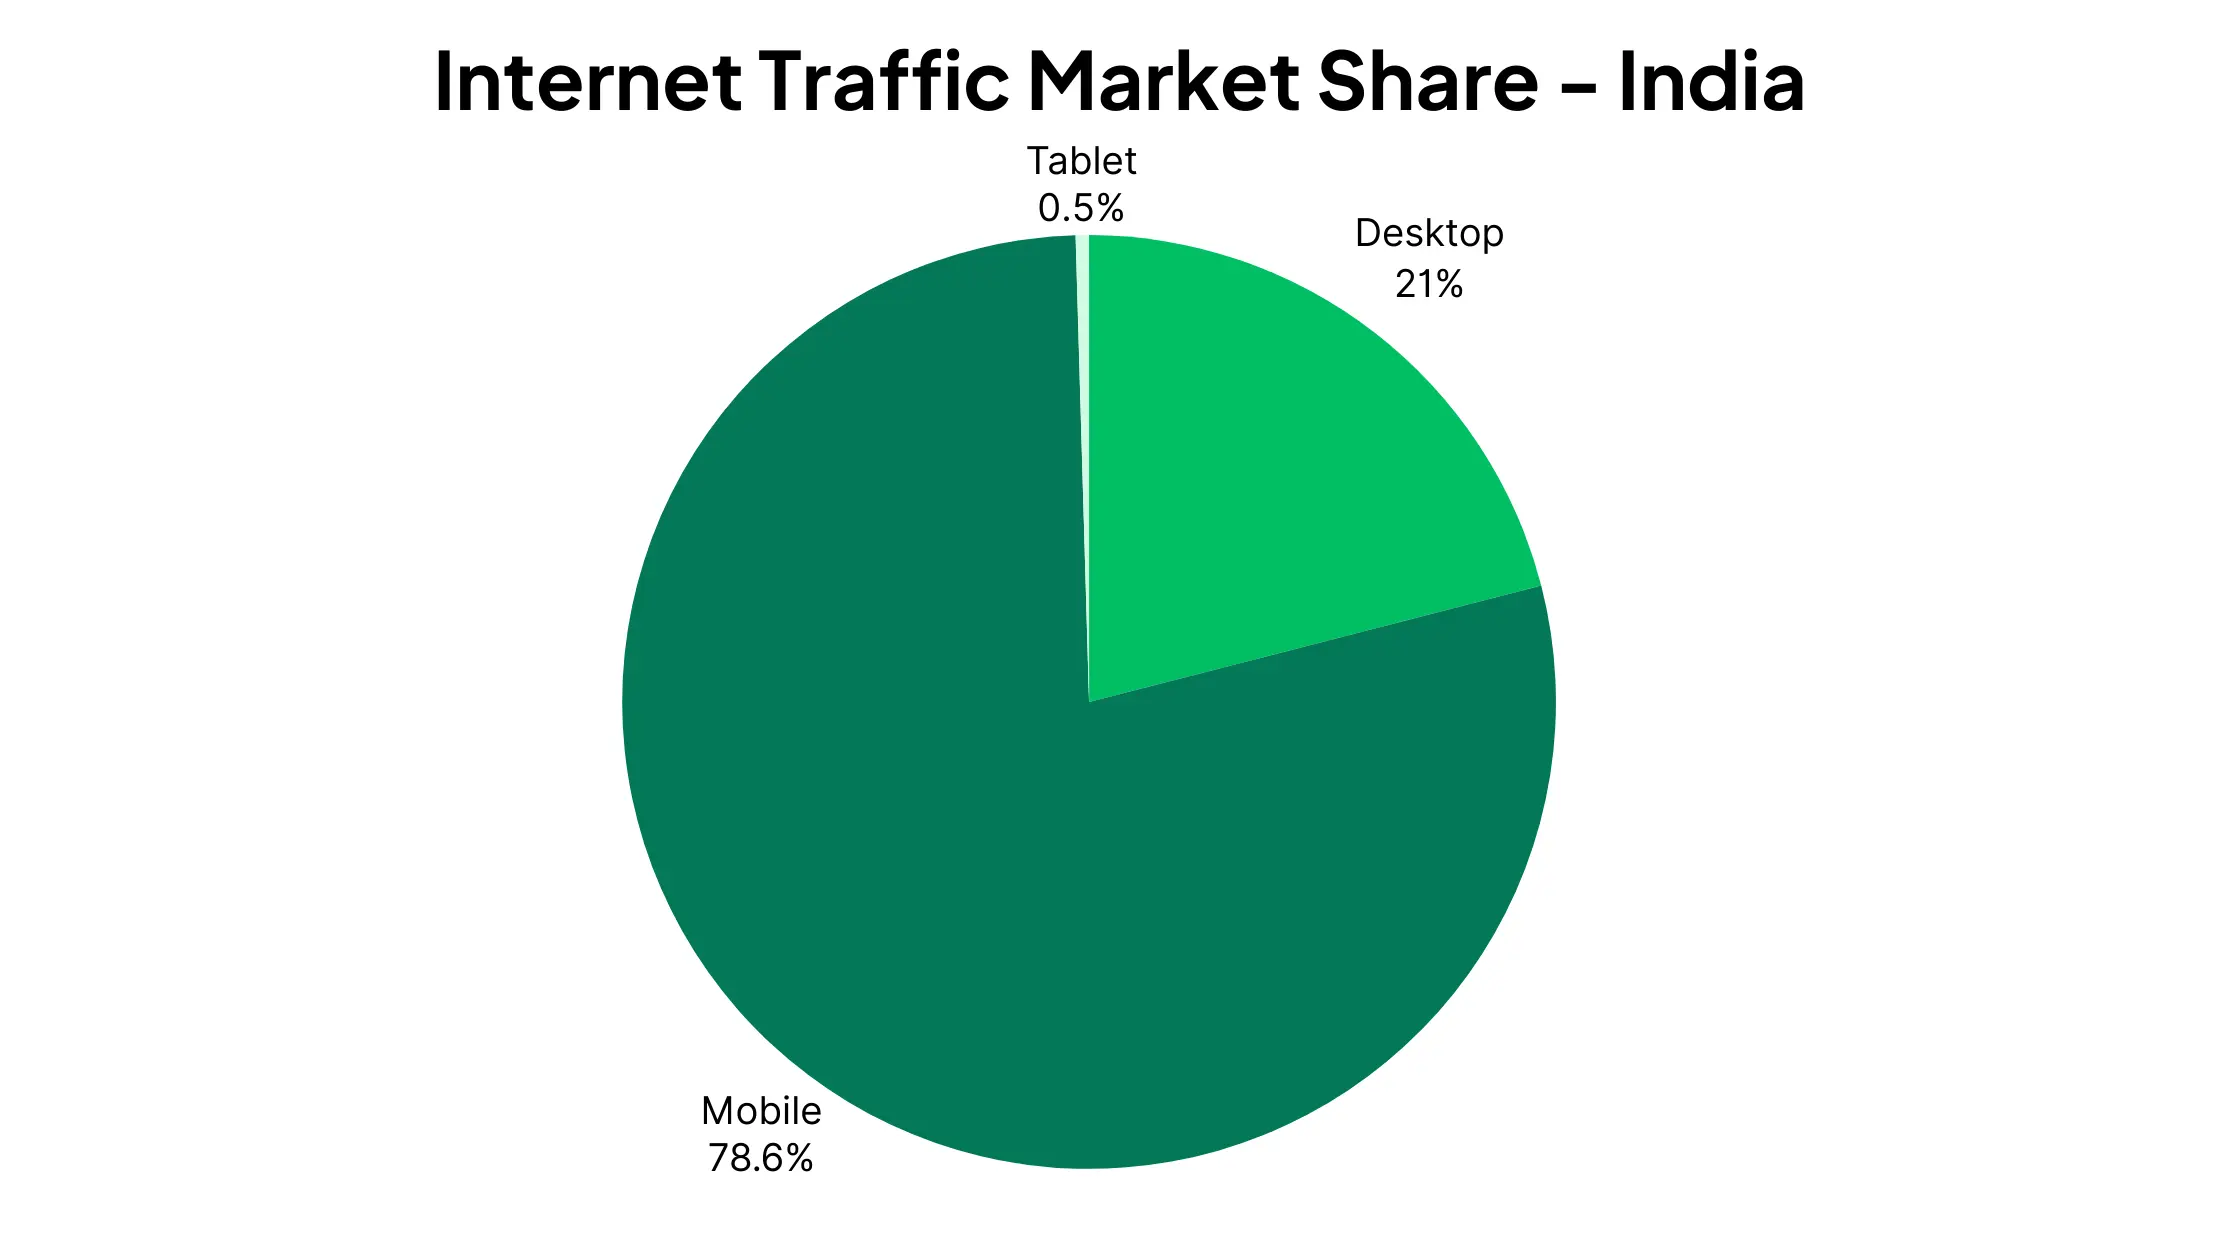
- Singapore and India are among the most prominent major countries for mobile web usage, and both have been relatively steady in this statistic since 2018.
- The highest country for mobile traffic market share overall is Sudan, with 83.92%.
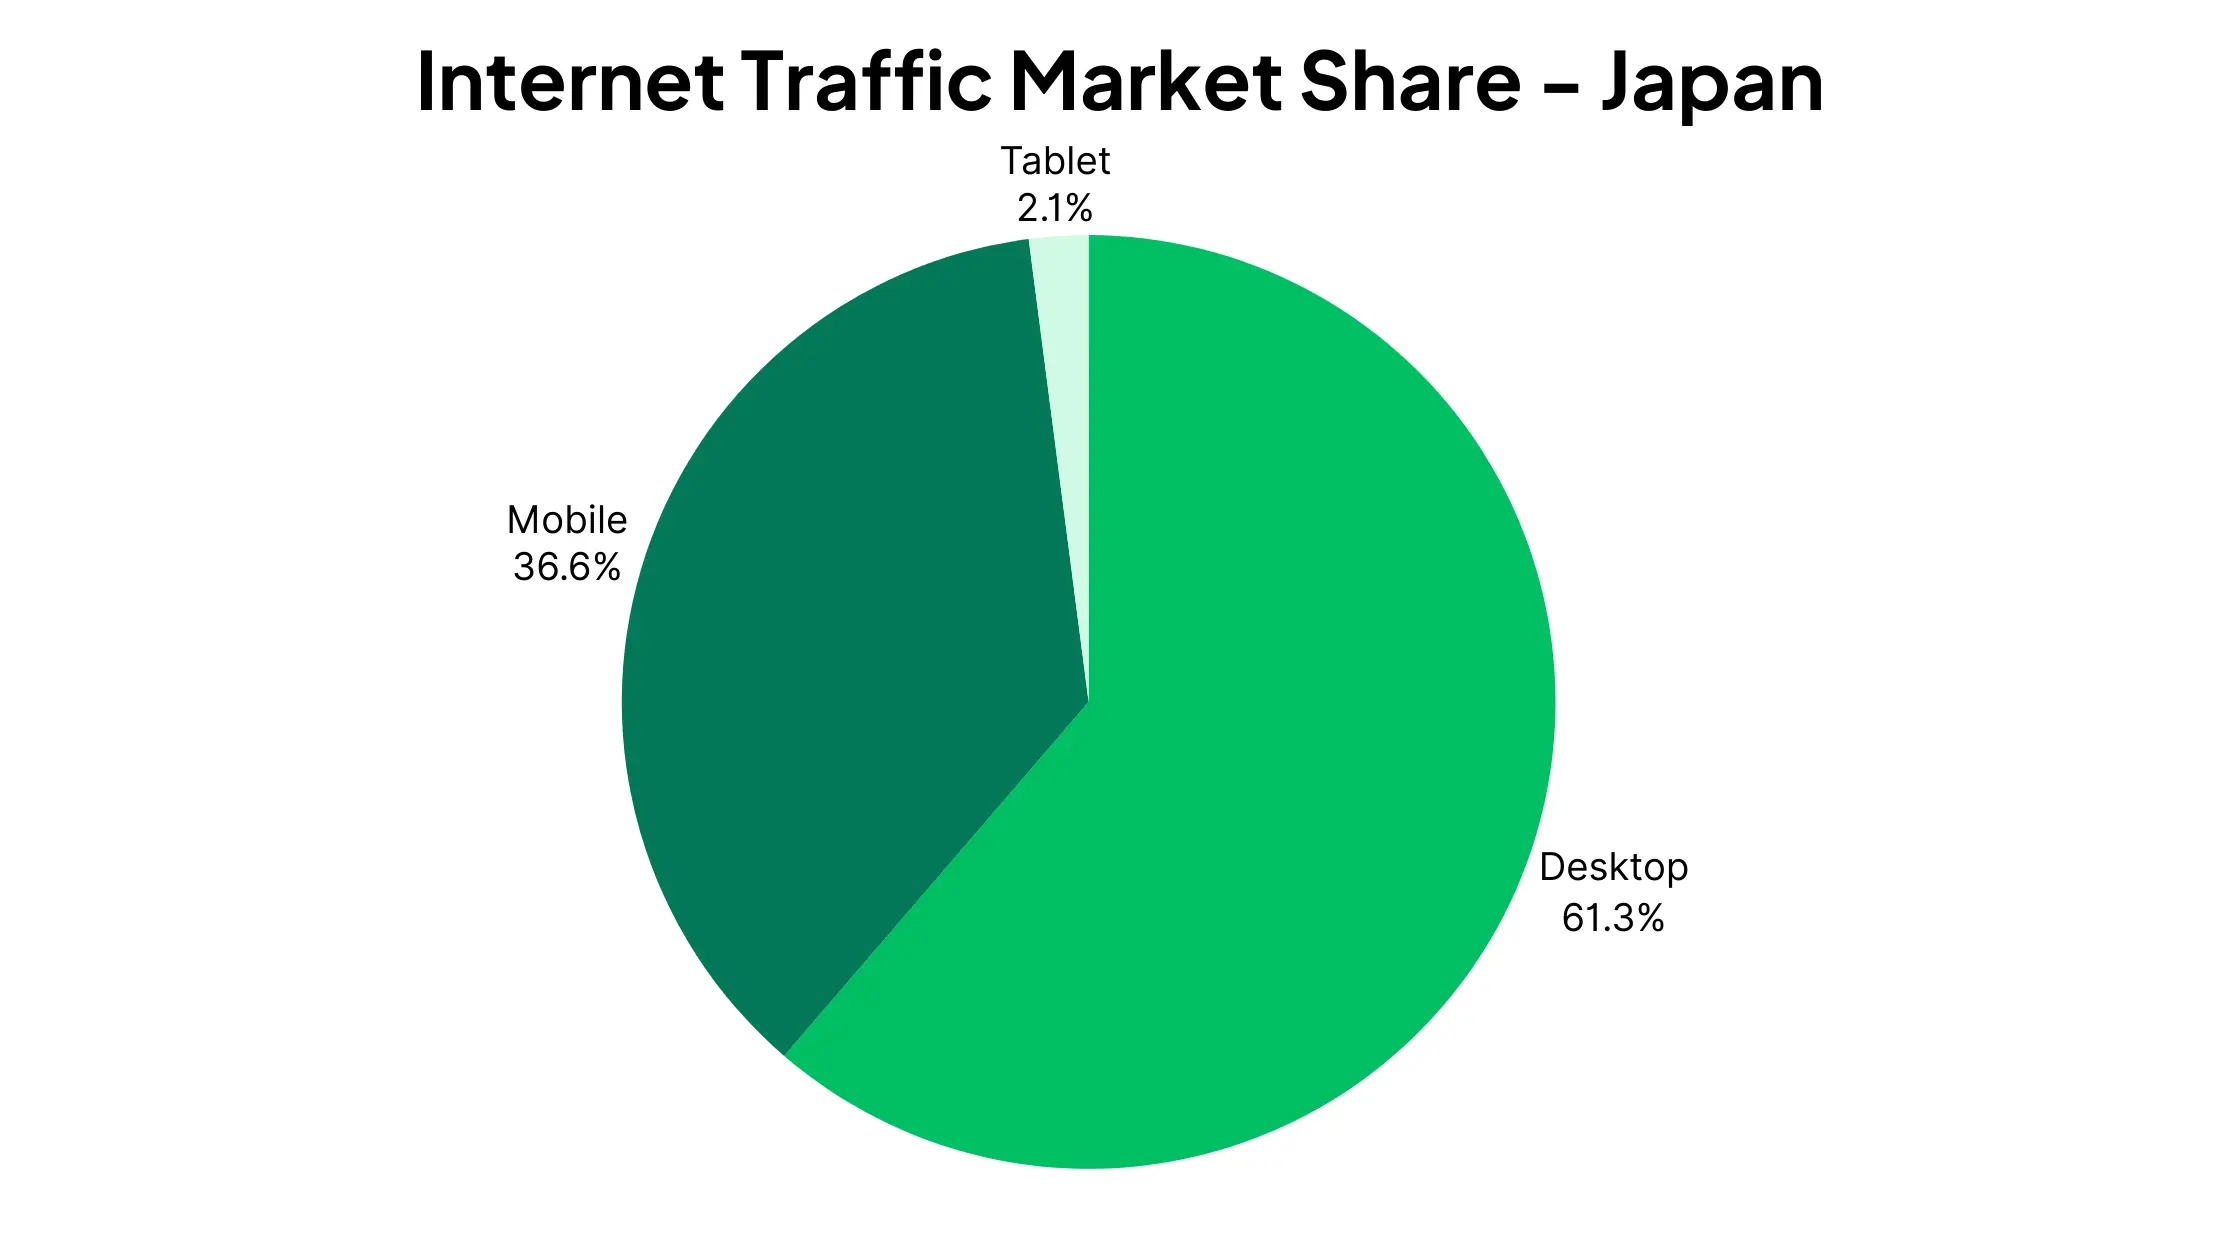
- Japan is one of the strongest countries for dekstop market share in 2024, with 61.30% market share vs only 36.64% for mobile.
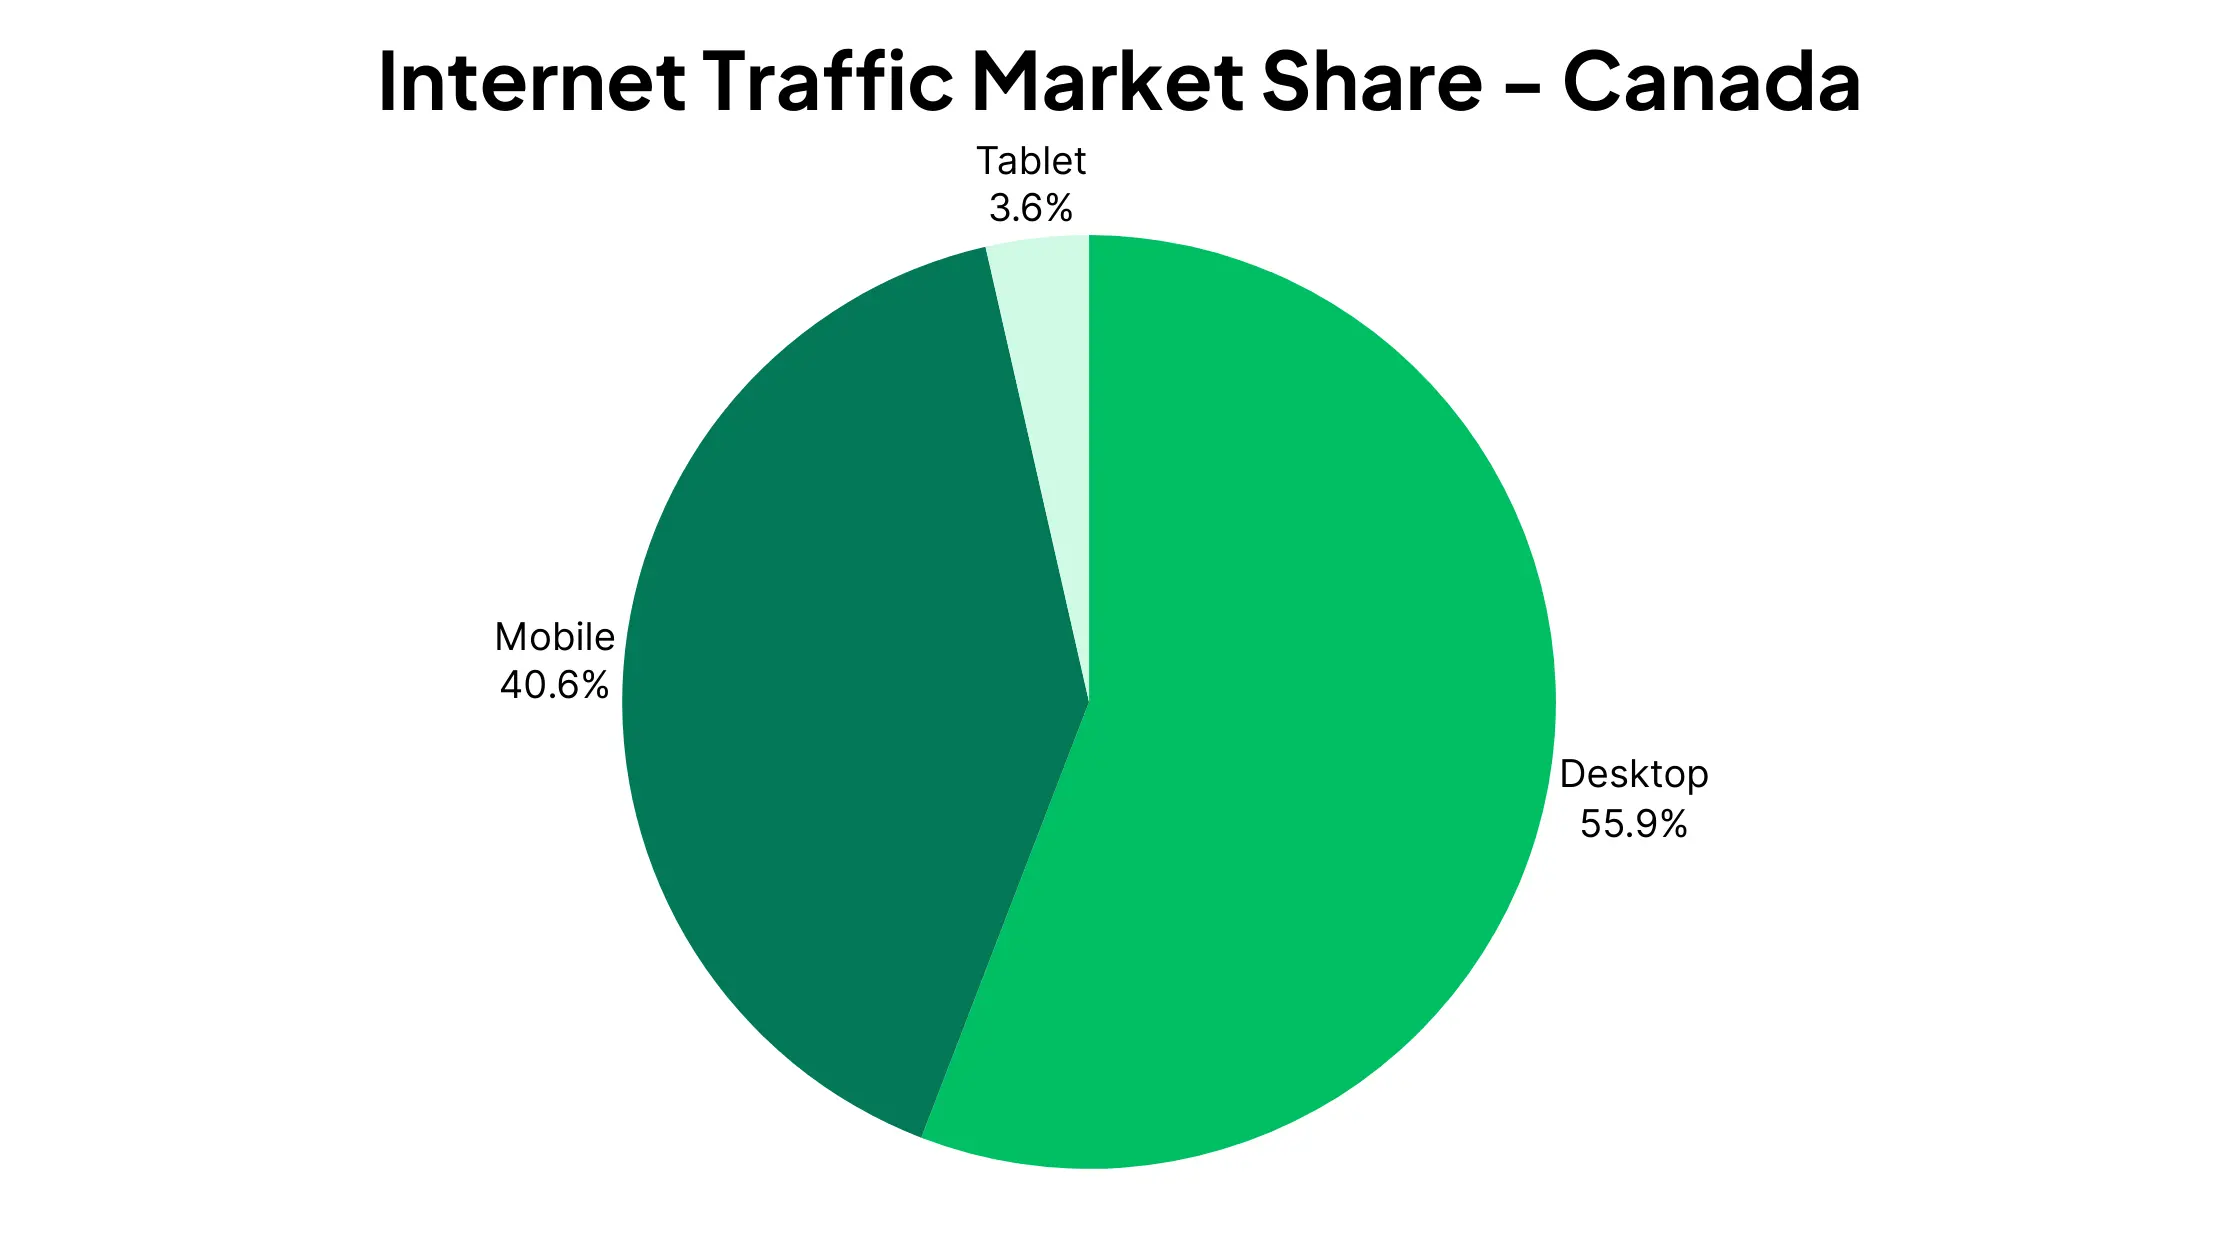
- Canada, Australia, Germany and the US are a few other notable countries to favor desktop over mobile, with all scoring between 40-45% mobile internet market share.
Key Statistics on Mobile Web Usage
Let's finish up with some general statistics on the state of mobile vs desktop web traffic today.
- 64.4% of people worldwide can access the internet via a mobile phone (via Statista).
- Ireland, Norway, Saudi Arabia, and the United Arab Emirates are the top countries in the world for mobile internet penetration, with a 99% penetration rate in each.
- Mobile internet penetration in the US is 91.8%, 97.8% in the UK, 96.9% in Singapore.
- The average download speed for mobile data worldwide is 41.54 Mbps (via Speedtest).
- The countries with the fastest mobile internet are the UAE (178.25 Mbps average), Qatar (174.56 Mbps) and Norway (143.55 Mbps).
- The countries with the slowest are Cuba (3.44 Mbps), Afghanistan (4.14 Mbps) and Venezuela (6.59 Mbps).
- 63% of search traffic in the US comes on mobile devices (via Statista).
- 15% of adults in the US only ever access the internet via mobile phones, and do not have access to regular home broadband internet (via Pew Research).
Now let’s examine some key statistics on how people use the internet on mobile devices.
Do more people use mobile apps or mobile browsers? How much time do we spend using apps? Which countries use apps the most?
Here are some interesting data points:
- Chrome has 64.86% of the mobile browser market share, followed by Safari (24.86%), then Samsung Internet (4.49%).
- We spend nearly 90% of our time on mobile devices using apps.
- Average time spent in apps increased up to 50% in some areas between 2020-2022.
- Indonesia, Singapore and Australia rank among the highest countries in app usage, with over 5 hours spent in apps per day.
- More than 100 billion hours are spent each year using shopping apps.
- Apps, on average, have a 157% higher conversion rate than mobile sites.
Check out more data and insights on mobile apps vs mobile websites here.
Final Thoughts
Data shows us that the rate of mobile vs desktop internet usage has exploded in the last 10 years. There are more smartphone users than ever, there are mobile friendly websites, and you can do almost everything you can on desktop devices with a mobile phone.
In many areas, mobile is now the preferred way for people to go online. In others, such as the US and UK, mobile market share almost equal or slightly behind desktop.
All the data indicates that global mobile vs desktop internet usage statistics should only increase as years go on, mobile internet becomes faster and more dependable, and mobile devices become more powerful and sophisticated.
If you’re running a business with an online presence, there are clear benefits to launching your own app, to better cater to mobile internet users.
The benefits of mobile apps include a better user experience, higher retention and engagement, and increased brand presence.
While it can take hundreds of thousands of dollars to create a native mobile app, MobiLoud will convert your existing website into Android and iOS apps in weeks, for a tiny fraction of what you’d pay app developers.
This is the best way for businesses to hop on the mobile internet bandwagon, and grow their mobile user base and revenue.
Click here to learn more, or get on a call with one of our app experts to discuss how MobiLoud can help you build mobile apps for your business.
Since you're already here, did you know that you can get a free preview of your app in 30s? All you need is your website's URL.
Get started with a free account. No credit card required.